

The Most Important Question Being Asked Right Now
And the Data to Answer It

The daily drumbeat of data center drama reached a crescendo this past week, when the Federal Energy Regulatory Commission (FERC) weighed in with an unambiguous thumb on the scale in favor of demand-side energy flexibility as a short term (and possibly long-term) solution to the grid challenges posed by new large loads. This decision fell on the heels of Google and Voltus agreeing to a three year capacity deal for Virtual Power Plants (VPPs) in PJM, and ERCOT moving forward with the creation of a statewide market for EACs.
Flying under the radar a bit is a surge in utility mandates to expand VPP programs, in particular in Virginia where Dominion Energy is being asked to allow large loads who can offset their grid impacts with distributed energy resources to be given priority in the interconnection queue, and in Nevada where Microsoft and NV Energy released their framework for how to quantify grid impacts from data centers as well as corresponding mitigation efforts.
Across all of these (and plenty of others too numerous to detail) is a question that bedevils regulators, grid operators, data center developers, public interest advocates, and DER developers. What is the value of a DER?
What is the Value of a DER?
Typically, the way we’ve valued DERs in the past has been either as a function of bill savings or on an avoided cost basis relative to grid alternatives. For example, a battery at a commercial site might be used to lower peak demand, thus reducing energy bills. A utility incentive for this battery might be sized based on avoided energy generation costs, reduced infrastructure costs, or lower GHG emissions.
The grid side of this equation is opaque. Lore has it that when you ask utility grid operators what the value of a DER is to them, you get answers ranging from “absolutely nothing” to “we hate this idea” to “we just do what our regulators require us to do” to “go look at appendix 35b on page 384 of this obscure PDF that we release once every three years and cross reference it with a different PDF that uses a completely different framework and do the math.”
You’ll have better luck with wholesale markets, which sometimes recognize DERs as capacity resources (PJM is a good example) and sometimes allow some DERs to participate in ancillary services markets, but where the value of a DER varies widely from market to market, and this value is based less on what the DER actually contributes and more on the particular rules of that market operator. More often than not, the value of DERs is based on vibes more than any concrete empirical framework.
But as the examples at the top demonstrate, the vibe era is over. If we’re going to allow data centers to mitigate their grid impacts with DERs, whether on a KW basis, a kWh basis, or a dollar value basis, we need to be able to consistently and accurately quantify what DERs are delivering to the grid.
Introducing GridSolver
Today we are releasing, through the OpenEAC Alliance, a new tool called GridSolver. The purpose of this tool is to start a conversation around how to value DERs as grid resources. If demand-side energy markets are going to scale, there must be a methodological framework that can be used to value the impact of DERs in a consistent way across different jurisdictions.
I encourage you to go visit the GridSolver page and click around a bit to get a feel for the data that we’ve surfaced, but I’ll also describe it a bit here. This work began as an exploratory exercise to look at what data might be available (inspired in part by the good work our friends at GridStatus have done on this front), then transitioned into asking the question whether it would even be possible to connect the dots from readily available data to the granular impacts of DERs.
Consider, for example, the challenge of differentiating between how DERs might solve transmission constraints versus how they might solve distribution constraints. A transmission cost is incurred when energy has to be moved long distances from where it is generated to where it is consumed. The more power that gets consumed from far away generators, the greater the transmission costs. But these costs might actually be a good thing! Consider the recent transmission lines that were completed in New York and California, which will allow hundreds of megawatts of clean energy to reach some of the most energy intensive regions of the country. In Texas, transmission congestion pricing peaks during periods of high renewable generation, when highly polluting fossil fuel power plants are priced out of the market and power is delivered over hundreds of miles of transmission lines from wind farms out in the plains.
On the other hand, distribution challenges reflect the limits of local grid infrastructure. Your local substation is built to provide a certain maximum amount of power at any given time to the surrounding neighborhoods. When everyone wants to charge their car at the same time as they are running their air conditioner, the substation reaches its thermal limit to absorb power from the transmission line and serve it to the local distribution network. If you install batteries in homes to flatten the load curve of the local neighborhood, does this translate to relief for the transmission grid? How would we know?
In developing GridSolver, we ended up building a vertically integrated data hierarchy of the grid, starting at the individual building level and going all the way up to the transmission grid. We framed it as a way to answer the following question:
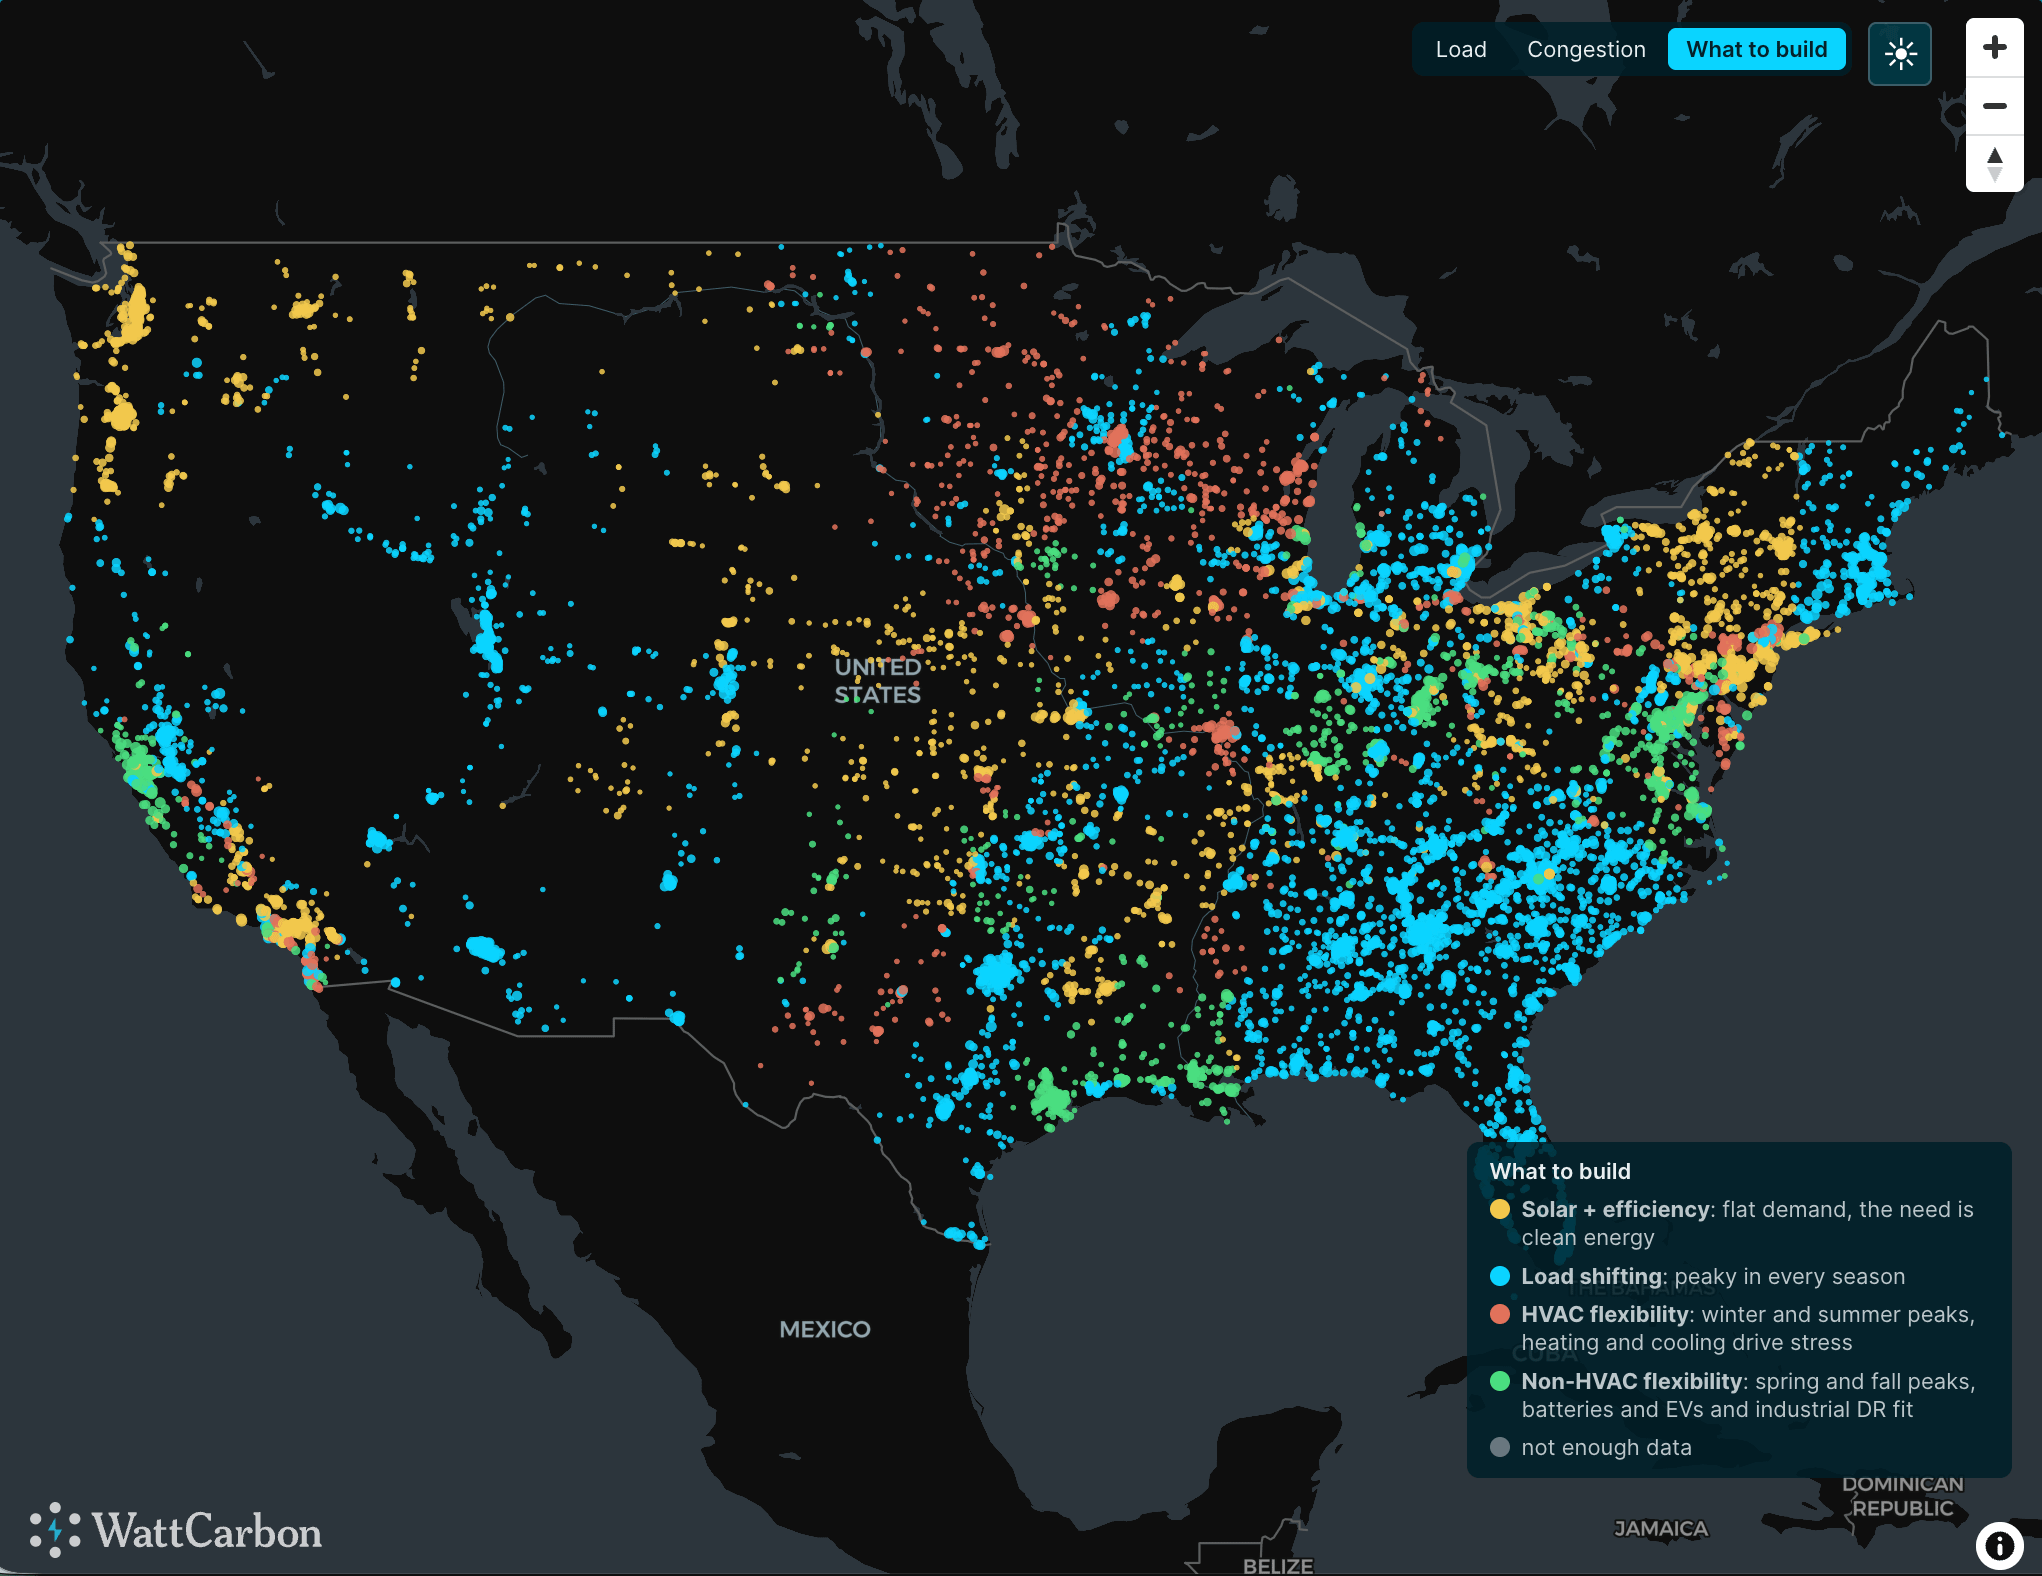
given both the transmission and distribution challenges faced by any given substation anywhere in the country, what would be the optimal type of DER to deploy in that area?
The data is instructive, directional more than conclusive, but we’ve been able to pull together a couple of useful pieces of the puzzle in a novel way that I’ll describe below.
The GridSolver Stack
Generation
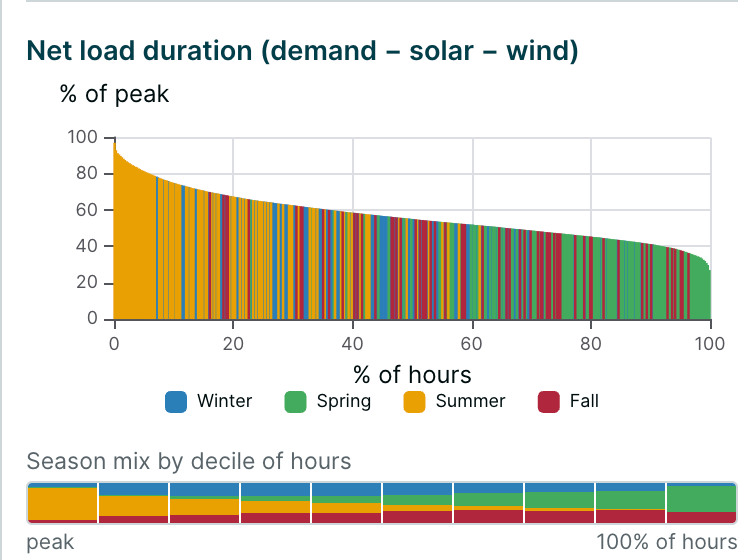
For any given point on the grid, we can start by asking how much power is needed from available power plants at any given hour of the day. For each balancing authority, we identify the net demand of the grid (total demand minus wind and solar) to know when the most stressed hours of the year occur. The best way to understand the peakiness of the grid is to look at the drop between the most stressed hour of the year and the 90th percentile most stressed hour of the year. The larger the gap between those two points, the more amenable that grid is to flexible resources that can shift load into less constrained hours. As the difference between the highest constrained hours and the median constrained hour grows smaller - i.e., the utilization rate of the grid improves - the DER solutions that will make the greatest impact become longer duration energy efficiency and solar projects.
Transmission
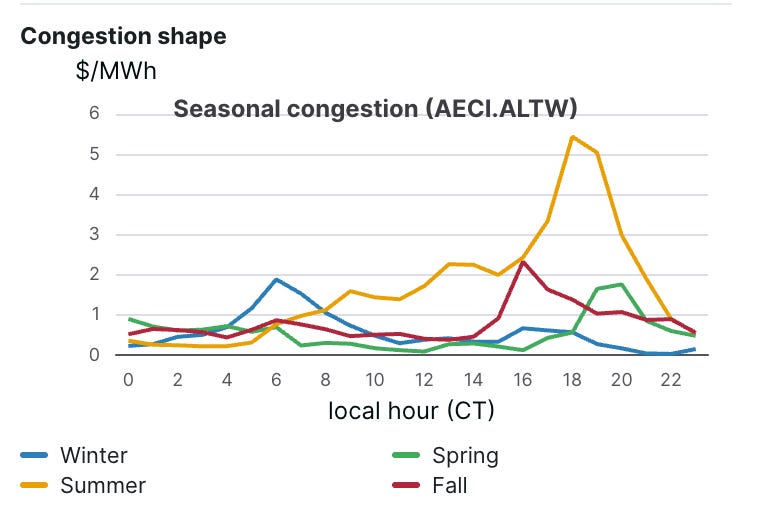
Some balancing authorities are home to an Independent System Operator (ISO), like PJM, CAISO, ERCOT, MISO, etc., and these ISOs publish market prices for energy, congestion, and line loss. These price signals are helpful because the add a different dimension to total net load. They price the cost of producing electricity in the first place, as well as moving the electricity from the point where it is produced to the points where it is consumed. ISO energy prices clear in a uniform fashion, but the cost of congestion and the loss rate vary by subregion within an ISO (down to individual price nodes in some places). Isolating the congestion component of the Locational Marginal Price (LMP) helps narrow down the places where adding DERs can significantly reduce the cost of bringing electricity in from far-away generation. Typically, these high costs of transmission are seasonal and concentrated in particular times of day, so we’ve isolated this congestion metric in the map and provided both a national view of where congestion is particularly concentrated (larger gap between the most congested hours and the 90th percentile) and we’ve made this metric available at the smallest geographic increment possible.
Distribution
The step down from transmission systems to distribution systems is deceptively challenging to build a data model around. One way to think of this is to imagine that the transmission system is like the railroads, while the distribution system is like subways. Sometimes the tracks overlap (like Penn Station in New York), but for the most part the systems are operated with minimal coordination. It may be convenient for Amtrak to make a single stop at Penn Station, even if it means that the subway gets overcrowded due to the influx of new riders at that stop.
Further challenging is the fact that distribution grid data is housed within utility data systems and generally not made publicly available. So while we might know where a substation is located, and we might know what its rated capacity might be, we don’t really know how much power actually flows through or where it might most benefit from the addition of new DERs. So we have to get creative.
For GridSolver, we’ve decided to anchor the map on the substation location, so every dot on the map represents a substation, but the data connected to that dot has very little to do with the actual substation. Generation data is sourced from the balancing authority, transmission data is sourced from the ISO. For the substation itself, we go in a different direction.
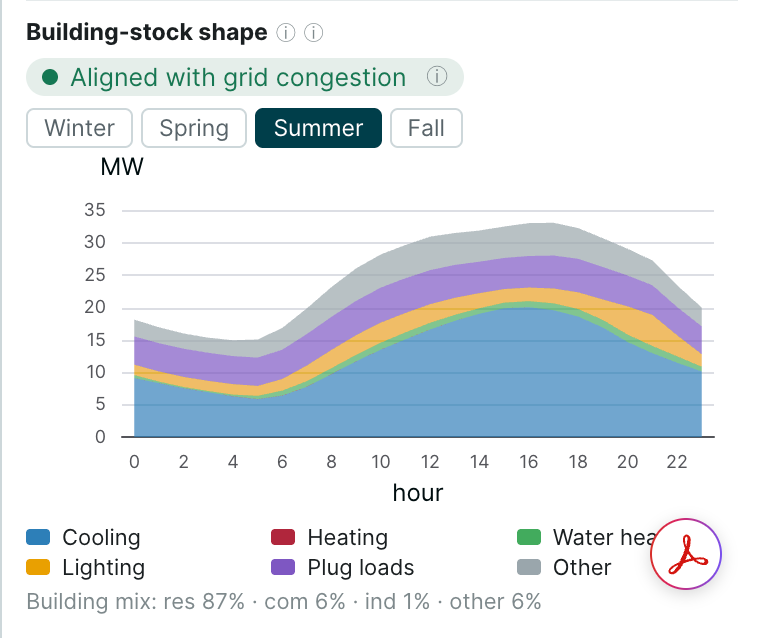
In the absence of reliable utility data, we have instead constructed a ground-up model of the entire US grid. The way we did this was by mapping every structure in the country and classifying it according to its end use (e.g., residential, commercial, industrial). Based on the size and location of the structure, we used NRL End Use Load Profile data to build an hourly load profile for each structure. Then for each substation, we drew a 7.5 mile radius around the substation and added up all of the buildings located within that radius.
This gave us two useful pieces of information. First, it helped estimate the likely peak load on any given substation (what hour of day, which days of the year) and second, what the likelihood is that any given grid constraint could be solved for with DERs. If there simply aren’t very many buildings surrounding a substation, it’s unlikely that anything more than a trivial grid constraint would be a good bet for a DER-first strategy. On the other hand, more dense population centers can more than support even large data center projects. One limitation of the NREL data is that it combines electricity and natural gas energy use, so winter electrical loads are inflated where there is a significant amount of natural gas or fuel oil heating. This data also doesn’t account for the presence of rooftop solar or onsite storage, which means that in solar heavy states like California, the typical loadshape will be significantly lower during the middle of the day.
Still, combined, this data provides us with unique insights into the dynamics of grids across the country. In some areas, high congestion and high energy use variability overlap. Other areas see neither high congestion nor high energy use variability and some only see one or the other.
DER Optimization
As a final step, we asked the question, “what type of DER would be best suited for the dynamics of any particular grid region?” To answer this question, we built an algorithm that evaluated the peakiness of energy and transmission constraints relative to the availability of local buildings to serve as DER hosts. Assigned to each substation, this GridScore provides a consistent framework for evaluating potential DER value anywhere in the country. In areas like the Southeast without an ISO market to price congestion we have to simply rely on the energy portion of the score, and because the WECC has barely begun to price congestion regionally, we are limited in the conclusions we can draw from those prices in that region as of today.
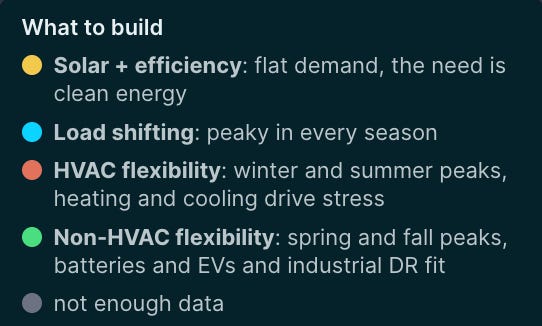
However, there are strong patterns that stand out. We see most of the country impacted by either peaky energy use, peaky congestion pricing, or both, but these happen during different times of the year. The upper Midwest is dominated by winter and summer peaks. The Pacific Northwest’s large hydro reserves and mild climate keep loads flat and congestion low. The Southeast’s load curve spikes in all seasons.
While there are likely many combinations of DERs that would make sense in each of these areas, the biggest bang for the buck will come from those that directly address the dominant costs to the grid. That means in places like Minnesota, where spikes are related to heating and cooling requirements, DERs that directly address HVAC related loads will be the most impactful. On the contrary, in San Antonio, where in all four seasons there are spikes, DERs like batteries that can respond in highly flexible ways will be the most useful. This is not to say that a battery wouldn’t also be useful in Minnesota, or that HVAC optimization won’t help in San Antonio, but rather the utilization rate of the DER might not be optimized in those areas.
DER ELCC
This brings us to a final concept: Effective Load Carrying Capacity (ELCC). ISO markets discount the capacity value of DERs by the likelihood that they will be available to respond to dispatch requests at designated times. This is an entirely discretionary value - as evidenced by very disparate values assigned by PJM and MISO for demand response. It’s also an incomplete concept. Time and locational impact of DERs is foundational to their value, but the use case is going to matter. If a behind-the-meter battery is deployed for the purposes of eliminating non-coincident peak demand charges it is almost certainly going to be dispatched at times of the day when the grid does not need it. Similarly, a lighting retrofit will only save energy when the lights are on - which could be at the exact wrong time of day to be beneficial to the grid.
GridSolver does not provide this ELCC metric. But it does point us to the importance of a new settlement layer for DER markets. The most interesting of these markets are being formed at the utility level, not the ISO level, and the value of a DER is now less associated with a utility avoided cost and more with efforts to increase grid utilization to support large load growth without raising customer rates.
As we contemplate leveraging DERs to offset the grid impacts of data centers, it will be incredibly important that we have clear and open methodologies for determining the grid value delivered by DERs, so that commitments being made on the part of data centers (or being required by regulators) to fully mitigate the costs to other users of the grid can be quantified and transacted in ways that inspire confidence to all sides of the market and that can be trusted by the public. The worst thing possible right now would be to treat these DER commitments like carbon offsets and wind up ten years down the road with a bunch of fake DERs that were never really installed, never really delivered any value to the grid, and only wound up lining the pockets of those with the worst of intentions.
GridScore and the OpenEAC Alliance
WattCarbon has been leading an effort to create transparent methodologies for measuring the impacts of distributed energy resources through the OpenEAC Alliance. GridSolver is being released as a collaboration with Resilience Energy under the auspices of the OpenEAC Alliance. We are excited to welcome them to the OpenEAC Alliance Board and look forward to future partnerships with other organizations who share our vision for demand-side energy markets that truly value DERs as climate-positive energy and grid resources. Over the next few years, as long-term offtake agreements for DERs become commonplace, the settlement layer for DERs will play an important role in unlocking this market. We invite all participants in these transactions, from DER developers to utilities to large load offtakers to join us in developing and refining these methodologies.