What happens to carbon intensity when it gets hot?
A brief look at *the grid*
With yet another hot summer finally releasing its grip on most of the US, grid operators are breathing a sigh of relief, but they are still well aware that we’ll likely never have a summer less hot than this one. Climate change is a giant Catch-22. More electrons will be needed for future summers, but the more that our grid relies upon fossil fuel plants for relief, the harder it will be to curtail carbon emissions to a survivable level. The worse things get, the more we turn to the very solutions that worsen our present circumstances.
WattCarbon is working to improve our ability to measure and track the carbon intensity of the electricity we consume. Our hope is that with greater transparency, simpler metrics, and standardized accounting, we can empower governmental and private organizations to bend the arc of climate change in the opposite direction from which we are currently heading. Optimistically, at some point in the near future, a heatwave will hit and our energy systems will be both resilient and carbon negative, so that as we take care of our immediate health, safety, and comfort needs, we also enable the survivability of our planet.
To illustrate the nature of the challenge, we wanted to take a closer look at how hot weather affects the carbon intensity of the grid. Our data are all sourced from publicly available records. Our partners at Carbonara make this kind of research possible by collecting and normalizing production data from the more than 80 balancing authorities in the United States and Canada. Each balancing authority is responsible for dispatching a sufficient supply of electricity to consistently meet the demands of its local utilities. When demand nears peak levels, certain additional resources are dispatched, such as backup generators or demand response. This data reflects the actual mix of energy on the grid that is served to customers. Thus it would include backup generators, but not demand response resources (negawatts).
For this analysis, we looked at hourly carbon intensity (pounds of CO2 per megawatt-hour) for each of the balancing authorities in the United States. We’ve highlighted a few specific locations in this report for the purposes of illustration. We focused on the week of August 7-13, when much of the United States was blanketed by a heat dome, with air temperatures on the West Coast in the triple digits and heat indexes on the East Coast similarly high. These types of days are called “peak events” by utilities when all available production resources must be dispatched in order to meet the energy demands of customers. For the purposes of comparison, we also looked at the week prior (July 31st through August 6th) and a cooler, late spring week (May 15-21).
Carbon intensity increases as temperatures rise
Across all balancing authorities in the US, normal carbon intensity can range from zero (for areas that receive 100% of their electricity from hydroelectric dams) to over 2,000 lbs of CO2 per megawatt-hour of electricity where coal is the primary source fuel. For a typical early summer week, the US grid will average around 800 lbs/MWh. During the week of the intense heat we looked at in August, the average CO2/MWh across the US increased to 935 lbs, confirming that the power resources called upon to meet peak consumption needs were, on average, more polluting than what operates during more normal conditions.
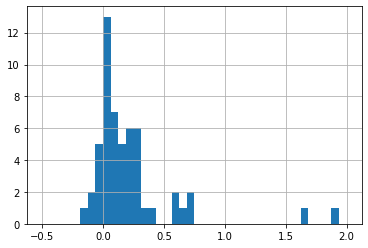
Carbon intensity within balancing authorities varies, depending on the particular mix of fuels that supply power during peak consumption days. For example, in a region with sufficient hydro resources, hot weather will have no material impact on the carbon intensity of the grid. On the other hand, where backup generators are powered by diesel fuel, the additional carbon load can be more substantial. For a few balancing authorities, we saw an increase in the carbon intensity of more than double between the middle of May and the middle of August.
Distribution of shoulder to hot week increase in carbon intensity (1.0 = 100%)
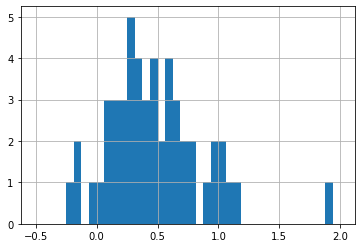
Of course, carbon intensity is only one measure of climate impact. As temperatures increase, more energy is required. Each additional megawatt of carbon-intense energy generated will result in a greater amount of CO2. So while the carbon intensity of the grid is increasing, the total amount of production is also increasing, meaning that total carbon emissions increase faster than carbon intensity alone. On average, between May and August, overall emissions in the US increased by more than 50%. It took three weeks in May to produce the same amount of carbon emissions that only took two weeks in August.
Distribution of shoulder-hot week increase in total carbon (1.0 = 100%)
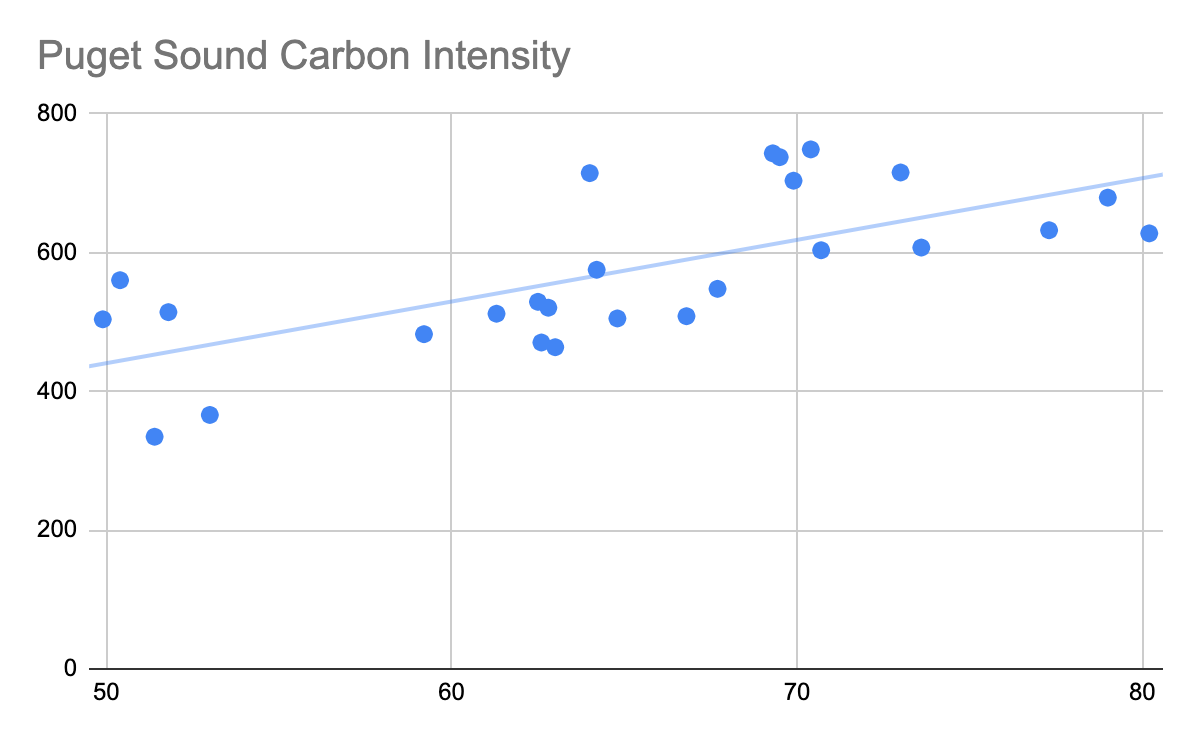
Another way to look at the impact of higher temperatures on carbon emissions is to correlate average daily temperatures with carbon intensity. In some areas, carbon intensity increases relatively little as temperatures rise. Other areas see quite significant increases in carbon intensity. Take, for example, the balancing authority for Puget Sound Electric, which serves the communities surrounding the city of Seattle. With its mix of hydroelectric power, natural gas, and wind energy, Puget Sound can provide relatively clean baseload energy from its hydro resources, and clean, albeit variable, wind energy. But it relies on natural gas to balance these renewable resources with grid demand and to provide extra capacity when the weather turns hot.
We can see how hot weather changes the resource mix in the Puget Sound area. On cool late spring days, when the average daily temperature at the Seattle-Tacoma airport stays in the low 50s, the grid carbon emissions range stays below 600 lbs/MWh. But as average daily temperatures rise above 70 degrees (highs in the mid-80s to 90s), carbon intensity consistently stays above 600 lbs/MWh.
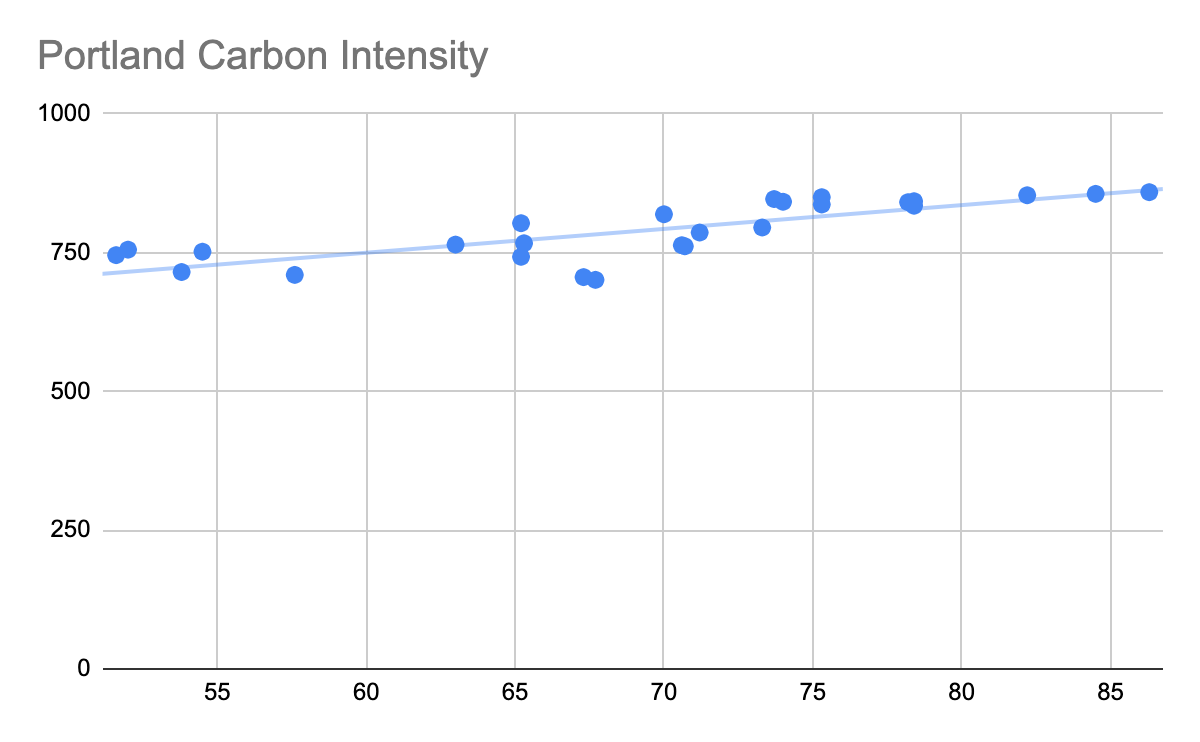
By contrast, nearby Portland General Electric, which serves a large portion of Northern Oregon, is barred from accessing the clean hydro resources of the Bonneville Power Authority. Instead, Portland gets most of its electricity from fossil fuels, even in the base case. So while its carbon intensity rises modestly when temperatures rise, a similar fuel mix powers Portland’s electricity during the very hot days relative to the cooler weather of the spring.
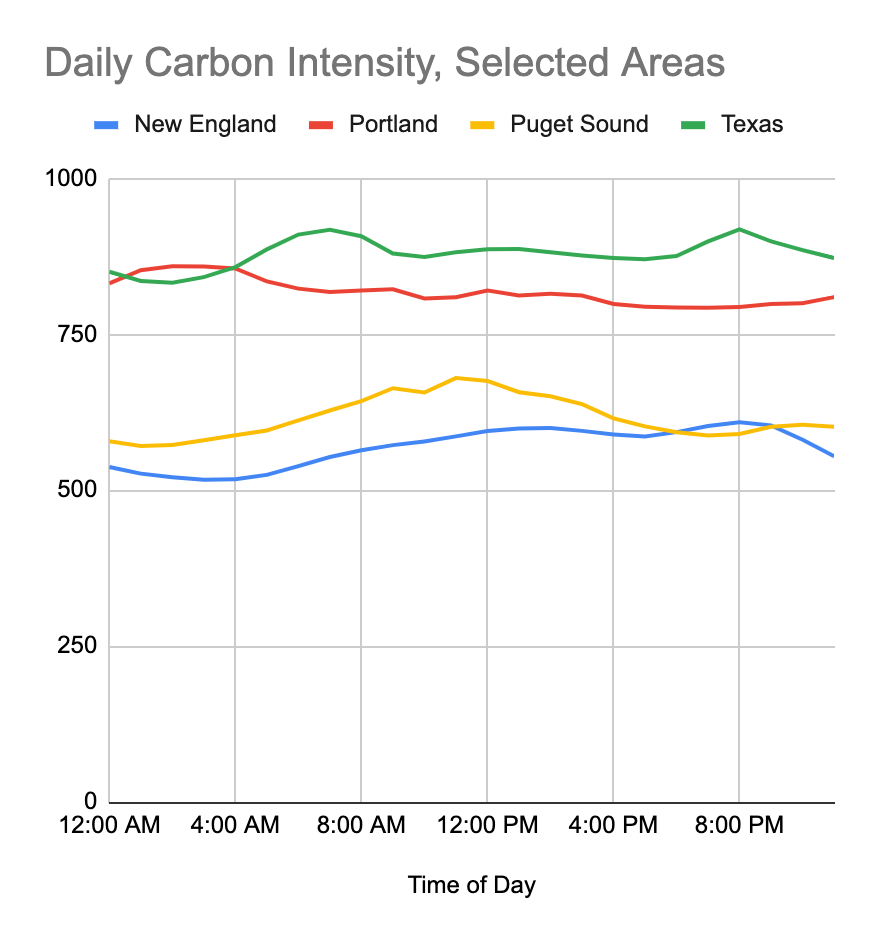
The final piece to observe is the granular temporal aspect of carbon intensity. California is now famous for its “duck curve” in which renewable energy (mainly solar) provides a significant share of electricity during the day but then disappears as the sun goes down, to be replaced largely by fossil-fueled peaker plants (a problem confounded by demand spikes at the same time of day). California’s travails have been well-publicized, so we wanted to take a look at whether carbon duck curves might show up in other parts of the country too. To do this, we averaged the hourly carbon intensity for the hot week in August to create a blended carbon load shape for the week.
What’s notable about these patterns is the lack of a consistent trend. Texas benefits from wind energy overnight, which depresses the carbon intensity of its grid during the early morning hours. By contrast, Portland’s carbon intensity actually declines over the course of the day while Puget Sound peaks during the late morning hours. New England sees a familiar bump in the early evening, perhaps reflecting the inexorable rise of air-conditioning across the region. Nonetheless, each of these trends is likely to be exacerbated by the growth of renewable energy in the coming years. The types of resources that are already cost-competitive will continue to be so, which means that the times of day in which renewables are plentiful will be amplified from their current status. We expect that commitments, such as Portland’s, to 100% renewable energy will change the carbon curve of electricity so that load shifting (whether from batteries, building energy management, or connected devices) will become the primary enabling function of renewable energy development.
Conclusion
There is no one-size-fits-all approach to decarbonization. Each of the 80 balancing authorities across the US and Canada powers the grid with its own mix of fuels, complicated by layers of state policy and local utility programs. But there are several dimensions of energy carbon emissions that can serve as a starting point for action.
We must break the correlation between carbon emissions and energy use. This means that end-users must be provided with visibility into the carbon intensity of their energy with enough granularity that discretionary consumption can be moved to low-carbon times of the day.
We need to be able to know which buildings can benefit the most from investing in decarbonization solutions like solar, storage, or load shifting. If we simply focus on annual averages, we’ll miss the greatest opportunities to have the most immediate impacts.
Investments in energy resources, building improvements, and controllable devices need to be informed by carbon reduction forecasting and ongoing monitoring. We’ll need to spend trillions of dollars over the next two decades rebuilding our energy infrastructure to be clean and resilient. Right now we’re flying blind. Better data will help us make these investments with more confidence that we’ll get the results we’re hoping for.


