


One of the challenges of building with AI is how fast everything goes. Features that would have taken weeks now take hours. Big ideas that would have taken months are now done in a week. The types of things we never would have tried are prototyped in a day. And as soon as something is done, three more projects are started.
All of this means that the bottleneck has become communications as much as anything else. This blog post is going to try to rectify that problem and share a bit more about what we’ve been working on. If you’re at all interested in a behind-the-scenes view of what it looks like to work on solving the problem of turning DERs into grid resources, keep reading.
One way to visualize how much AI is changing product velocity is by looking at Github commits. This isn’t a perfect proxy, but the scale is indicative of the increase.
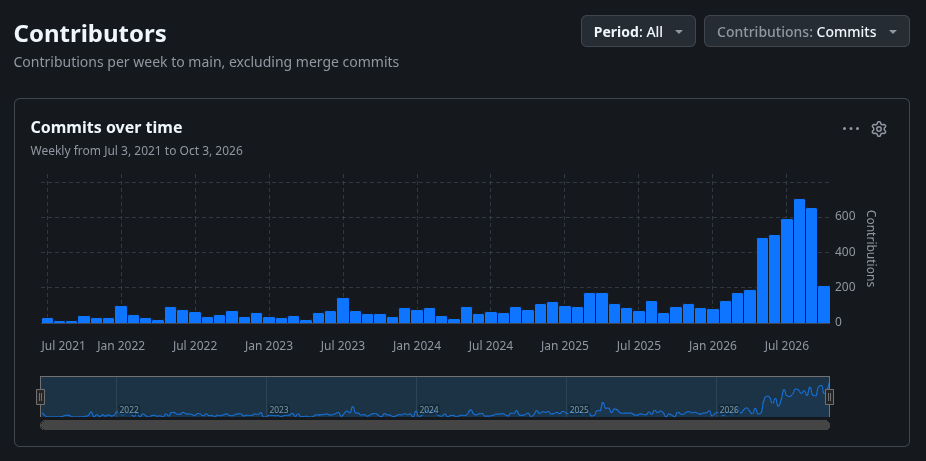
For our team, the jump is largely attributable to a decision to create devboxes for each of our team members (both engineers and non-engineers) and integrate Claude and Codex into the dev environment. That setup allowed each team member to use our existing codebase to create rapid prototypes, shareable over Tailscale, and to turn those prototypes into tested, deployable code with virtually no friction. Combined with the release of models that could write high-enough quality code (and a bunch of safeguards internally that prevent most slop from reaching production), we essentially went dark factory starting around May.
So what have we been working on? There are three main groups of features:
Agentic data science
Grid integration
Universal M&V
I. Agentic Data Science
AI is magical in many ways, but one of the biggest benefits is serving as a translation layer to highly complex subject matter. M&V is complicated enough that figuring out why certain results happened requires a relatively sophisticated understanding of data science. The amount of data to sift through also creates a paralyzing challenge of where to start.
We call our M&V agent “Aristotle” and we’ve been teaching it how to serve as an interface between our users and our data science tools underneath. A lot of this work is about building a “harness” that directs the agent to respond to inquiries in the right way and prevents answers that stray from what we would have intended. Every time that we add new functionality, the harness has to be tested to make sure that its new instructions don’t interfere with the quality of its existing knowledge base.
Practically speaking, when a user logs into their account, an Ask Aristotle chat allows them to use natural language to interrogate their data, e.g., what’s working, where are the poor performers, what do the outliers mean, how do the savings compare to what was expected? With many of our users negotiating deals with utilities, hyperscalers, and building owners, being able to show how their current projects are performing has been very important for proving the impact of their projects.
Agentic chat is table stakes for most companies these days, and while it’s been a big unlock for us, the bigger value will come from combining data science with reporting. This is a much bigger technical lift - data provenance and auditability are essential here - but the implications are enormous.
Imagine being able to run a continuous integrated resource planning analysis with live inputs from every end point on the grid, every distributed energy resource, real-time price inputs, and integrated grid modeling. Then changing the formatting and layout of your report with simple chat inputs and exporting to key stakeholders in the form of a custom PDF or a live external website via HTML.
Or consider how valuable it would be to model the impacts of a portfolio of batteries, knowing exactly what the existing load profiles of a particular area’s buildings were, what transmission constraints were found in the area, and the deferral benefits for the local distribution grid.
Or let’s say you have contracted for a portfolio of demand-side energy resources and you want to know how they are performing. Instead of waiting around for the utility to update your data, you can just stream them to a personalized dashboard with the metrics that matter to you, whether it’s capacity, energy, emissions, or bill savings (or something else entirely).
At the rate we are moving, it’s highly likely that these use cases are just the tip of the iceberg in terms of what chat-enabled data science will unlock. It’s not improbable that within a year there will be no need to ever commission a third party “expert” study. You’ll just be able to ask the question. Every day we get new use cases that we can load into our engine and every day we get closer to this reality.
II. Grid Integration
A few months ago we released GridSolver, a visualization of a dataset we started to assemble that would make it easier to understand the grid value of DERs. Since then, the only major visible upgrade was a “Predict” function, which gave a load forecast for every individual transmission substation in the country (this is not the congestion value, but rather a representation of how much energy demand is forecast for the surrounding area over the next six days).
But behind this front layer, we’ve been building a much larger data model of the U.S. grid from the point of view of DERs so that we can integrate site level M&V with the contextual data that defines its value.
This is probably the most ambitious and far-reaching undertaking we’ve tried. We’re effectively taking every possible source of data about the grid and organizing it into a relational database keyed on location so that the grid-DER relationship can be understood in multiple dimensions.
DERs are inherently bi-directional, even the ones that don’t actually push power back to the grid. The way to think about this is that a DER both responds to grid signals and is the source of grid signals. Most data out there is oriented to one or the other of these concepts, but not both at the same time. To hold both in a dataframe at the same time requires an entirely different way of thinking about the grid-DER relationship.
Generation, transmission, and distribution are all downstream of energy consumption. As demand rises and falls, the grid responds accordingly. But depending on how the grid responds, demand-side energy resources may actually counter-respond. The tail wags the dog.
Consider a heat wave. Energy consumption rises because HVAC use rises. Generators respond to price signals to increase production. Transmission grids send congestion price signals to optimize power flows. Distribution grids ensure that electrons reach their intended end uses. But as these various price signals are sent, HVAC controllers, embedded batteries, and other devices might respond in turn by decreasing demand, reducing the need for generation, and making congestion less of a problem.
Policymakers have decided that these DERs can be compensated, sometimes directly as if they were a generator, sometimes indirectly based on the costs of transmission and distribution, and sometimes just for being available in case grid resources are insufficient for the amount of power being demanded.
The data round trip starts with demand, which comes from individual end users, aggregates to generators that are managed by balancing authorities, and priced by either a wholesale market or a vertically integrated utility, and then priced again by a variety of stakeholders to encourage changes in demand from what would otherwise ordinarily happen.
As we map this in our platform it means that not only do we need to consume the obvious signals - wholesale energy prices, power system metadata, capacity prices, etc., - but also develop entirely new ways to understand grid dynamics. This is most apparent in the forecasting and modeling of demand, both short run and long run, as well as the value of DERs in different market contexts.
Consider the fact that grid stress is almost entirely due to one of two factors. Either the weather is extreme, driving up energy consumption, or one or more generators or important pieces of infrastructure is offline for maintenance or because of a malfunction. If it’s weather that is causing the stress, we can predict the amount of stress by looking at the individual energy use patterns of end users. If it’s maintenance or failure, it’s up to the utility to send out an SOS for relief.
From a modeling standpoint it means that we can build bottoms-up models for predictable sources of grid stress, and top-down models for unpredictable events. So we’ve created weather-normalized models of every building in the United States, with the capability of layering any future weather or energy intervention scenario on top, and we’ve made these aggregable so that we can estimate the impacts of DERs on knowable grid stress events. At the same time, the top-down view gives us visibility into how and when utilities value DERs as well as how DERs roll up from premise level to distribution grid to transmission grid to generators and regional authorities.
This functional combination is important because of the way energy markets are evolving. Increasingly, data centers and other large loads are being asked to “bring your own capacity” which is largely a function of forecastable grid stress events. At the same time, because grids are being run at higher utilization rates, there is less margin for error when it comes to unforeseen events or when utilities need to bring capacity offline for maintenance. In these situations, DERs can help bolster their long-term cash flows by agreeing to availability when otherwise their value to the grid would be very low.
To put this in more concrete terms, and something that GridSolver shows, weather/demand-driven stress is common in the summer and winter, while systemic stress is common in the spring and fall. The point of the data model is to understand how these interact with each other so that the full lifecycle value of a DER can be underwritten.
III. Universal M&V
By the end of next decade, upwards of 50% of all energy will flow through a DER, and most of this will be transactable, whether as energy, capacity, emission reductions, or something else. All of the work we are doing in support of agentic workflows, and data model intelligence is in support of the broader vision of a true demand-side energy market.
Today, DER settlement is largely an exercise in trust. Utility programs tend to use nameplate capacity or stipulated savings based on technical resource manuals to estimate savings. Wholesale energy markets use load-impact protocols that vary in sophistication, but are subject to gaming and abuse (witness recent scandals in PJM and MISO). New technologies are often frozen out of these markets by virtue of the fact that measurement protocols are inflexible and outdated.
For the past few years, WattCarbon has run the OpenEAC Alliance, an informal collective of DER developers, M&V professionals, and other stakeholders collaborating to define a consistent set of methodologies that allow all types of DERs to be transacted.
The challenge facing a company like ours is the vast sea of complexity that makes it difficult to cover all of the different potential types of M&V methodologies and the different permutations within each type. Normally this is handled by one-off spreadsheet applications, which are neither scalable nor particularly auditable, and so we’ve built software to automate M&V while maintaining the flexibility and auditability to extend to all types of DER assets.
One of the lessons we’ve learned in working with AI is that you definitely don’t want your AI bots doing your M&V for you. You get a different answer every time and you have no idea why. So if you are going to use AI it has to be in service of writing the deterministic code that executes the measurement process.
The infrastructure unlock that makes this possible in our platform is the concept of a “measurement job” which breaks down all of the individual steps and creates a reproducible set of outputs that are delivered alongside the savings value and are readable both by humans as well as our Aristotle chat agent. This allows the user to ask “how did you get this answer” and for the answer to be based on the actual outputs of the measurement job. The rule underneath Aristotle is that the AI never does the math. It only explains and navigates the results. When the user asks for the provenance of an answer, by definition there is always something behind it.
Where this has been magical is using these measurements to actually diagnose performance shortcomings in projects that would otherwise have never been noticed. Heat pumps with miscalibrated settings, solar panels that malfunction, batteries dispatching at the wrong time, etc.; these insights are actually saving as much energy in some cases as the original project. And because the measurements are automated, the AI agent can take a scan through the entire portfolio on a nightly basis looking for potential issues.
The reason to invest so heavily in universal M&V is because it unlocks procurement. The way that DERs will finally scale is through Power Purchase Agreements (PPAs) that direct large sums of capital to the deployment of different forms of energy efficiency, demand flexibility, and decarbonization. PPAs are fundamentally outcome-based procurements, meaning that you are not underwriting the asset itself, but rather the production of the asset, and the proof of impact that it delivers.
The reason that utility programs are so broken is that they are more or less agnostic to outcomes, instead choosing to prioritize politics and process. Audits are a classic example of do-nothing utility programs, where payment goes to the auditor simply for showing up, not for any realized savings. A PPA agreement anchors on the outcome, which in turn incentivizes audits and other work to maximize the value of the project. If we want DERs to turn into grid assets, they’ll need to be procured based on performance, and settlement will be critical to the way in which these performance contracts are underwritten.
Hopefully you’ve stuck with me here this far. We’re excited to keep pushing on the frontier of AI and energy, unlocking the value of DERs as grid resources, as decarbonization tools, and as a way to lower the costs of energy for everyone. If you’d like to learn more, feel free to reach out, or just create an account at www.wattcarbon.com and start playing around with sample assets and the chat tools that we’ve enabled. It’s endlessly fascinating!