

Aristotle Unleashed
Our own AI chatbot - trained on M&V

A little over a year ago, WattCarbon unveiled Aristotle, our automated M&V (measurement and verification) platform. We called it AI-powered because we thought it would help us get investors. But the reality was that what we had built was more or less just a really impressive automation of a set of processes that had never fully been stitched together before. We added progressive text loading to make it look like an AI chatbot output.
The truth is, you don’t really want AI M&V. You want to be able to trust the numbers, to replicate them, to audit them. AI makes all of this difficult. The potential for hallucinations makes it even worse.
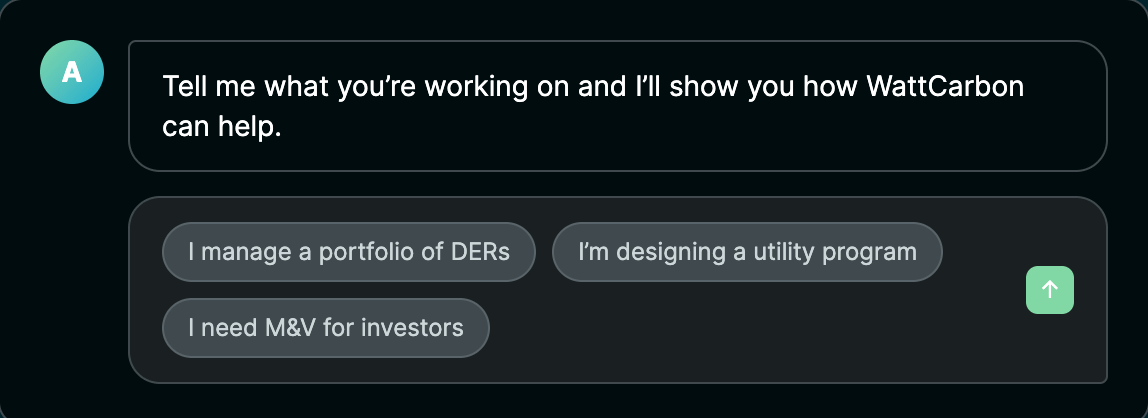
That said, when Claude Opus came out at the end of last year, I went on a vibe-coding bender and built a prototype of what I thought a real AI M&V tool might look like. I built a new version of our website at the same time and teased with this hero image:
I handed it off to the team a couple of months ago, and this week, among other things, we released it to our users. I thought it might be useful to describe where we landed with this product and why we think it will be useful for bridging what has historically been a fairly wide gap between the business of energy and the data science behind it.
Why AI complements M&V
The hard part of M&V isn’t really in the math. Even our most sophisticated algorithms are barely above high school level statistics. Where the trouble starts is when the numbers don’t add up. M&V is as much a process of patching holes as it is anything else. Missing data, erratic data, incomplete data, corrupted data, time zones, corrected data, government shutdowns, buildings changing owners, devices getting bricked, these are the stories of M&V.
So when it comes to M&V the hard part isn’t the happy path; it’s understanding the edge cases, how things go wrong, how wrong things get fixed, and whether to intervene in the project sooner rather than later.
I’ve spent the past ten years staring at more M&V data than pretty much any other person on this planet, and I feel like I have a pretty good intuition now for these nuances. But as I started working on what would become our Aristotle AI, what I really wanted was a chance to go deeper. To ask more questions. To better understand patterns in the data that were too hard to see with the naked eye.
This is where we pointed our Aristotle AI agent: at the layer underneath the raw data. Should I be concerned with the underperformance of this asset? What trends do you see in my portfolio that stand out as different than what I would have expected? Are there chronic errors that suggest underlying issues with my data? What does it mean to have a high CVRMSE?
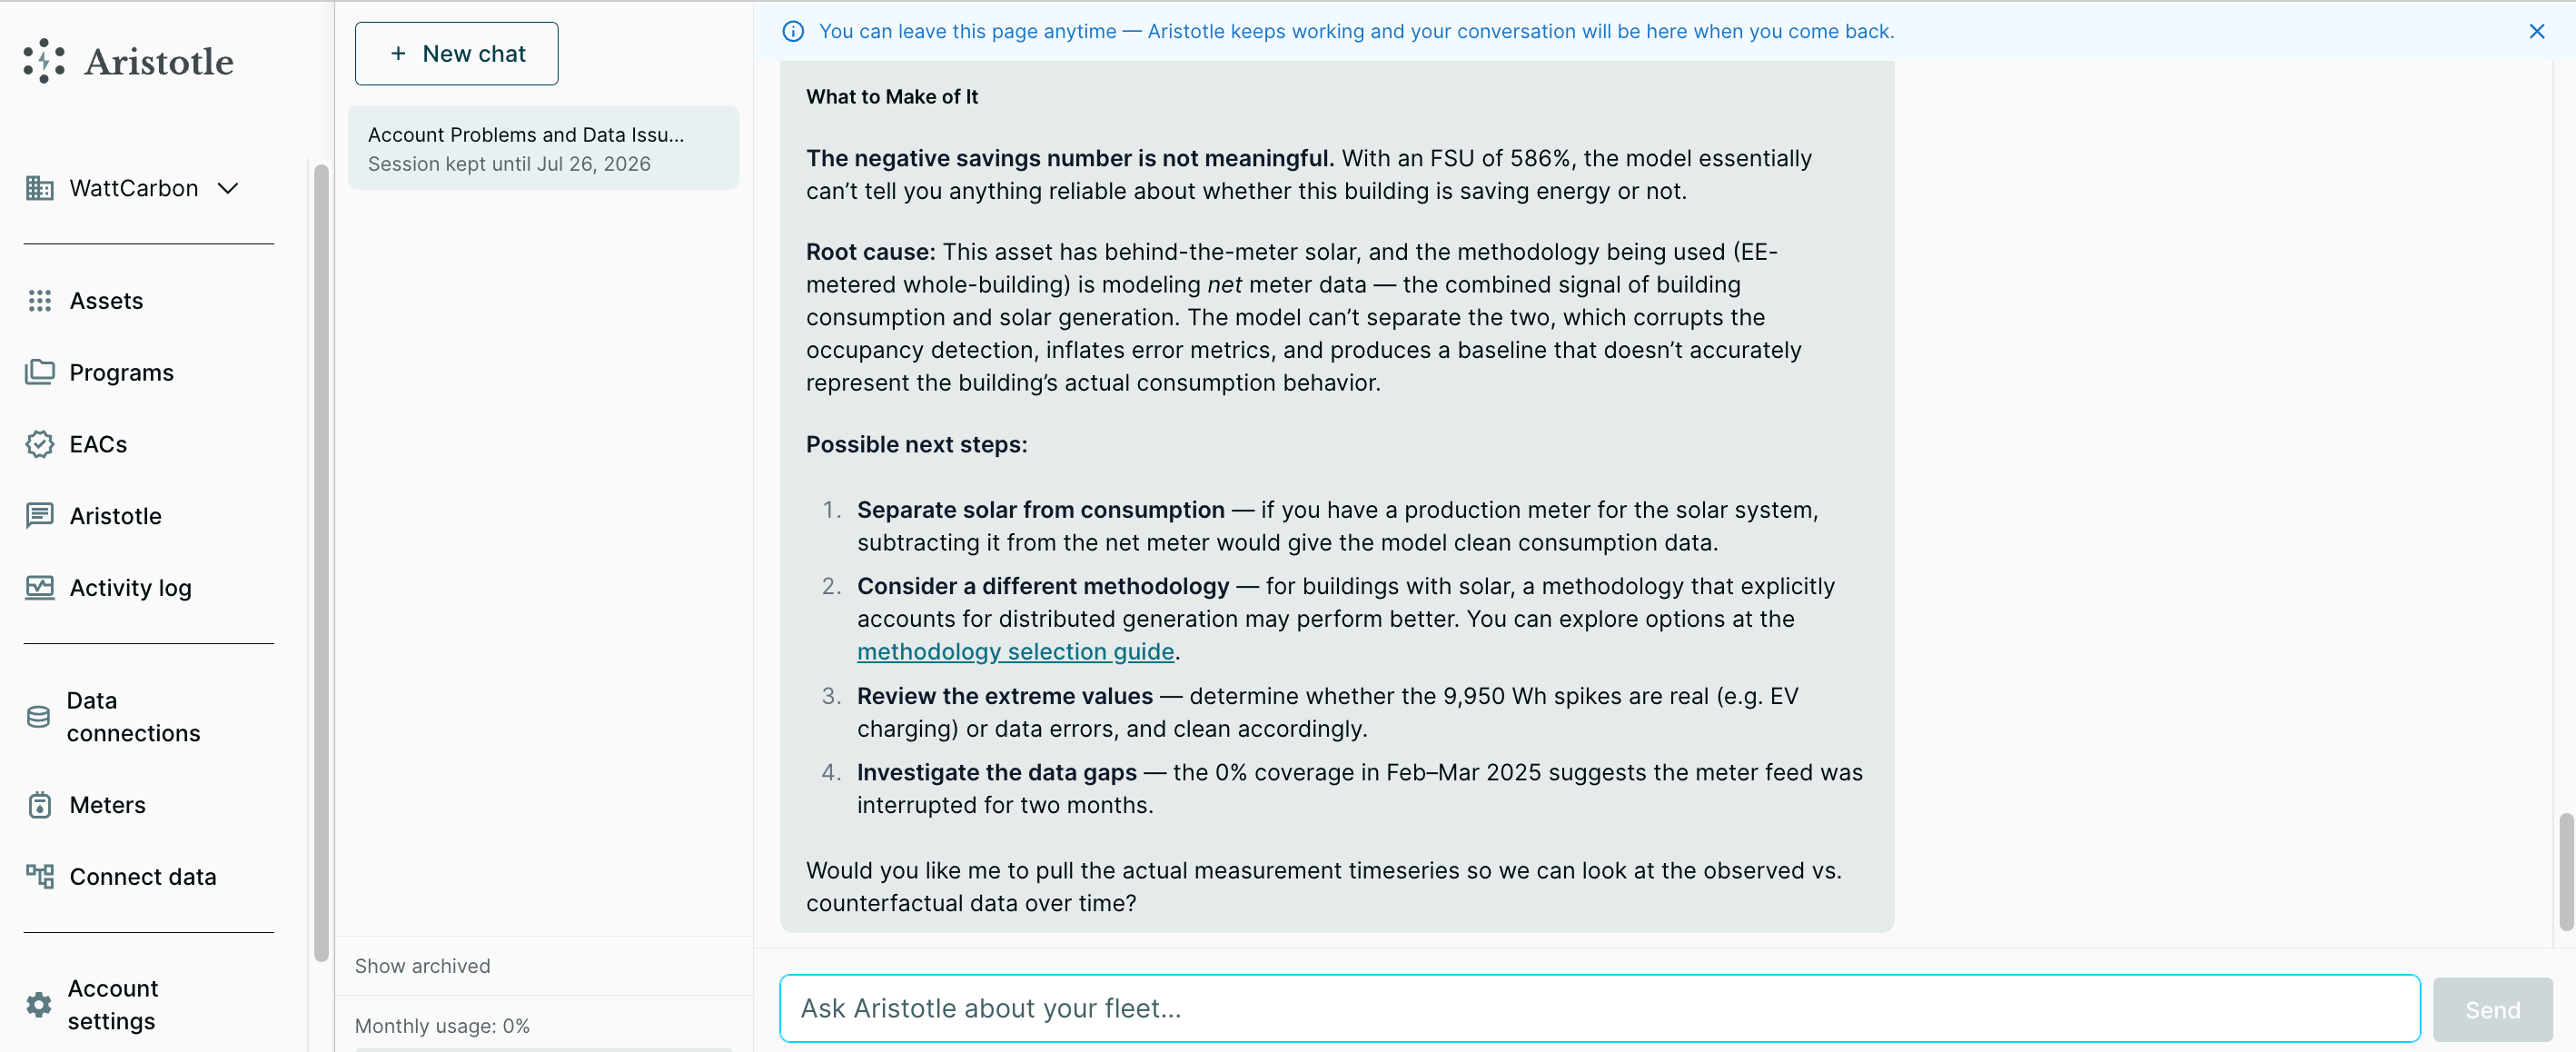
The best way to think about Aristotle is as a sherpa, and for those who are new to the world of M&V, once you start asking Aristotle questions, it’s hard to stop. It’s like unlocking a new world of insight that had been obscured by a thick fog of numbers before.
WattCarbon provides free access to its M&V tools (including Aristotle AI) to anyone who wants to kick the tires (the fees kick in when you want to use the API, create EACs, etc.). So I’d encourage anyone who has projects where energy savings are being calculated to give this a try. But for those who are underwriting performance contracts, investing in battery portfolios, and otherwise accountable to actual outcomes, what Aristotle unlocks is essential to your success.
And of course, now that we’ve released the first version, the floodgates are open. I’m pretty sure that next we’ll release AI-assisted data onboarding tools (those pesky Excel spreadsheets with awful formatting are child’s play for Claude these days). The roadmap has us extending the chat to include our grid data, DER grid planning and forecasting, and there will be new tools for data analysis that leverage the structured datasets that sit underneath our M&V.
In short, life just got a lot easier for teams on both sides of the M&V aisle, as the most annoying parts of the job are solved by the AI and the most fun and rewarding parts are centered in the user experience. Most importantly, the underlying calculations are still done in Python, meaning that we can be confident that the numbers coming out are supposed to look the way they do (even if we need to dig into why they came out that way). This is the essence of the modern automated M&V stack: transparent, replicable, and scalable data infrastructure that provides an end-to-end settlement layer for emerging demand-side energy markets.