

Introducing Aristotle: An AI-Powered Automated M&V Platform
Unlocking the future of energy decarbonization

On Tuesday, WattCarbon will release Aristotle, the first AI-powered automated M&V platform. For the trillion dollars that are invested into decarbonization projects each year, it answers the single most important question: “how’s it going?”
For you, the readers of our blog, we’re providing a deep dive into our thinking ahead of the release. Below is a white paper that outlines what we have built, how it works, and what use cases it unlocks.
On a personal level, the most exciting part of this product is the fact that we’ve eliminated/automated all of the work that goes into making an energy/carbon savings calculation so that not only can you know - within a few minutes - how much your projects are saving (making ROI calculations effortless), but also come back the next day for automatically updated information.
Here’s the plan: sometime Monday night or Tuesday morning, we’ll flip the switch on the site to unlock the new functionality. If you already have an account, you’ll be able to login using your existing credentials. If not, you’ll just create one and be on your way. You’ll have to be a customer of UtilityAPI, Arcadia, or Bayou Energy for it to work (that’s where we pull data from), though we also have the ability to calculate modeled electrification savings without requiring source data. Moving forward, we’ll be adding integrations with other data providers (hit us up if you have a request). Of course, we expect lots of edge cases. There will be a way to leave feedback in the app if something isn’t working or doesn’t look right.
For now, please take a read through the white paper below. We’d love to hear your feedback on our thinking. I’m going to try to figure out how to do a Substack Live on Tuesday to show and tell some of the cooler functionality (tentatively penciled in for 11am PT). Stop by and say hi to us! Of course the WattCarbon team deserves all the credit here. They’ve been working their tails off getting this across the finish line and deserve special recognition for what they’ve built. Thanks also to all of you for your support and enthusiasm. It’s a dark time right now, but brightness will come from the candles we light for each other to illuminate the path forward.
Introducing Aristotle
Measurement and Verification (M&V) is the cornerstone of proving that energy efficiency and sustainability projects deliver real savings. Traditional M&V methods—while grounded in decades of engineering practice—have often been manual, slow, and costly, providing only after-the-fact validation of energy savings. WattCarbon’s new Aristotle platform introduces a paradigm shift: it is the world’s first fully automated, AI-driven M&V platform that continuously verifies energy performance and hourly carbon impacts in real time.
By leveraging machine learning and advanced energy modeling technology, Aristotle delivers on the long-promised industry vision of “M&V 2.0” – continuous, real-time verification of energy savings and emissions reductions across building portfolios. This white paper details the technical innovations behind Aristotle, including its architecture, data inputs, methodologies, and the outputs it delivers, as well as how it builds upon (and goes beyond) industry-standard frameworks like IPMVP, ASHRAE Guideline 14, the Uniform Methods Project, CalTRACK, and emerging standards for carbon accounting.
Industry Standard Frameworks for M&V and Emissions Accounting
Over the past several decades, the energy industry has developed well-defined protocols to measure and verify energy savings from projects. Aristotle’s design is informed by these established frameworks, even as it extends them with automation and AI. Key standards and initiatives include:
IPMVP (International Performance Measurement & Verification Protocol): A widely adopted framework published by the Efficiency Valuation Organization (EVO) that defines standard options (A, B, C, D) for planning and implementing M&V. IPMVP provides a conceptual framework for measuring savings by comparing post-project energy use to an agreed-upon baseline (what usage would have been without the project). It is broadly applicable and acts as the foundation for many M&V projects worldwide.
ASHRAE Guideline 14: A technical guideline from ASHRAE (“Measurement of Energy, Demand, and Water Savings”) that provides detailed procedures and calculation methods to reliably quantify savings. Guideline 14 outlines three fundamental M&V approaches (Retrofit Isolation, Whole Facility, and Calibrated Simulation) corresponding closely to IPMVP Options B, C, and D. It also specifies statistical validity criteria (such as bias and uncertainty thresholds) to ensure models accurately represent the baseline, complementing IPMVP’s high-level framework.
DOE Uniform Methods Project (UMP): A U.S. Department of Energy initiative providing a library of model M&V protocols for specific energy efficiency measures. UMP guides offer step-by-step methods (e.g. for lighting retrofits, HVAC upgrades, etc.) to consistently determine savings, serving as a practical supplement to IPMVP for evaluators and program administrators.
CalTRACK: An open-source methodology for meter-based energy savings analysis. CalTRACK standardizes how to calculate normalized energy consumption and savings at the building meter level, often using high-frequency data (daily or hourly). For example, the CalTRACK hourly modeling approach characterizes a building’s energy use as a function of temperature, occupancy, and time-of-week, enabling consistent hourly baseline predictions for M&V. These methods have been implemented in software (like the OpenEEmeter) to support “M&V 2.0” programs where large volumes of interval meter data are analyzed automatically.
Emissions Accounting Standards: Traditional M&V frameworks focus on energy (kWh or fuel units) and demand (kW) savings; translating those savings into carbon emissions reductions is a newer frontier. Many organizations rely on general guidance like the GHG Protocol for inventorying emissions, but GHGP does not provide methods for project-level avoided emissions. The industry is now developing standards to fill this gap. For instance, WattCarbon is a founding member of the OpenEAC Alliance, a coalition of M&V experts dedicated to transparent methods for calculating carbon savings from distributed energy resources. OpenEAC builds on frameworks like IPMVP and UMP, but extends them to include hourly carbon impacts, reviewing and approving methodologies so that emissions reductions claims are credible and consistent. Each approved methodology in OpenEAC (for example, methods for Whole-Building Weather-Normalized Savings, Heat Pump Electrification savings, or Demand Response events) is versioned and published openly to ensure community trust. WattCarbon’s platform uses these methodologies as the basis for its calculations, ensuring Aristotle’s automated results are aligned with industry best practices (and can be audited against those standards).
By referencing and integrating these frameworks, Aristotle’s automated M&V engine doesn’t reinvent the wheel, it builds upon proven techniques for baseline modeling and savings verification. However, it also advances beyond traditional practice by automating the process end-to-end and incorporating granular, real-time carbon accounting that legacy protocols did not address.
Limitations of Traditional M&V Approaches
Conventional M&V, while reliable, comes with well-known challenges that have limited its scalability and responsiveness:
Manual, Labor-Intensive Process: Traditionally, energy savings verification requires energy engineers to design M&V plans, collect and clean data (often utility bills or logger data), and perform one-time statistical analyses or simulations. Different engineers might choose slightly different methods or assumptions for the same project, leading to inconsistency (the “100 engineers, 100 methods” problem). The need for expert judgment means higher costs and longer timelines. In practice, M&V can add 5–10% to the total project cost, an expense that can discourage evaluation of smaller projects. The process can take months or even years of post-retrofit data to produce a final savings report, by which time the data is outdated.
Slow Feedback and Limited Frequency: Because of the effort involved, traditional M&V analyses are typically performed infrequently, perhaps a single ex-post analysis after one year of operations, or periodic annual evaluations. This delay means building owners and sustainability managers wait a long time for feedback on whether an efficiency project is performing as expected. If savings are off track, the opportunity to correct course in real time is lost. Moreover, many conventional M&V analyses rely on monthly utility bill data, which obscures short-term performance issues. Important variations in performance (like a HVAC system efficiency dropping during certain hours or a controls issue on weekends) might be averaged out in monthly data. Granular insights, for example, identifying what hours of the day most savings occur, are not available with coarse data.
Static Baselines and Simplified Carbon Estimates: Standard M&V computes a baseline that represents what would have happened without the project, often only adjusting for weather and other factors in a static fashion using “typical” weather values. However, real buildings and grids are dynamic. Traditional methods have not typically incorporated continuously updated models or high-frequency adjustments to real-world conditions. Carbon accounting has been especially simplified. Common practice might use a single annual average emission factor (e.g. kg CO₂ per kWh) to convert energy savings to emissions avoided. This ignores the fact that grid carbon intensity can vary dramatically hour by hour. As a result, traditional reports of “X tons of CO₂ saved per year” lack insight into when those carbon reductions happened (e.g. were savings occurring when the grid was mostly renewable or mostly fossil-fueled?).
High Costs and Limited Scalability: Ensuring credibility in results often meant hiring third-party M&V consultants or implementers to perform independent analysis. While this third-party review adds rigor, it drives up cost and time, and still may not catch all uncertainties. For enterprise portfolios with hundreds of buildings or distributed energy resources, doing custom M&V on each asset is impractical at scale. The high cost and effort have been a structural barrier to valuing the climate benefits of many smaller distributed energy projects. Many valid energy savings projects go unverified because traditional M&V doesn’t scale easily without significant budgetary impacts.
These limitations set the stage for an “M&V 2.0” evolution: the application of software, smart meter data, and AI to automate and accelerate the M&V process. Advanced M&V (or “M&V 2.0”) aims to maintain the accuracy and rigor of classical methods while providing faster, more granular, and cheaper analysis through analytics. WattCarbon’s Aristotle platform is an embodiment of this evolution, addressing the above challenges by design.
Aristotle Platform Architecture and Data Inputs
Aristotle is a cloud-based, fully automated M&V platform that continuously ingests data, models expected versus actual performance, and generates verified energy and carbon savings. Its architecture is designed to seamlessly connect to a variety of data sources and to operate across entire portfolios of buildings and distributed energy resources. Figure 1 below illustrates the high-level system architecture and data flow for the platform.

Figure 1: Aristotle Automated M&V Platform Architecture. The platform integrates diverse data streams, including utility meter data, building IoT/BMS sensors, weather feeds, and operational context, into an AI-driven engine. This engine creates a reference model for each asset, as well as energy savings calculations and hourly carbon accounting. The outputs (via dashboard or API) include real-time energy & carbon savings reports, minted Energy/Environmental Attribute Certificates (EACs), alerts, and other insights for stakeholders.
Aristotle’s data pipeline begins with automated data acquisition from relevant sources: building energy meters, sensors, and contextual datasets. The platform can ingest interval data (e.g. 15-minute or hourly electricity consumption) from utility smart meters or sub-meters, either through direct utility integrations or data aggregators (existing customer accounts with providers like Arcadia, UtilityAPI, etc., can be linked to import historical and ongoing usage data). Additionally, it can collect data from building management systems (BMS) and Internet of Things (IoT) sensors for more granular operational metrics. These may include HVAC runtime data, temperatures, occupancy counts or schedules, basically any inputs that help explain energy usage patterns. Weather data (from local weather stations) is continuously pulled in, as outdoor temperature and other conditions are critical drivers for building energy models. The platform also incorporates static contextual information (building square footage, operating hours, equipment inventory) and project details (for example, the date an efficiency retrofit was implemented, or the capacity of a battery system). All these inputs feed into the core AI engine.
At the heart of Aristotle is the AI-driven energy modeling engine that creates a “reference model” of each tracked asset or building. The reference model is essentially a computational model that represents the asset’s ideal behavior (energy consumption or generation) under varying conditions, calibrated to real-world data. For a building, this could be capturing whole-facility energy use patterns; for a specific device like a heat pump or battery, the reference might isolate its performance (and interactions with the building or grid). Aristotle’s engine employs machine learning algorithms to automatically develop counterfactual models from historical data, for instance, using regression to relate a building’s energy use to weather and occupancy. The approach draws on techniques from CalTRACK and other open M&V methods (e.g., generating features for time-of-week and temperature dependency, and training models on pre-intervention data. What’s novel is that the platform performs this model fitting and calibration continuously and autonomously. As new data flows in, the reference model self-adjusts to maintain accuracy, a process akin to continuous commissioning.
In essence, the system is always answering the question: “What would energy consumption or savings be right now if the efficiency measures or DERs were performing as expected?” It uses that answer to deliver ROI feedback in real-time by running the calibrated reference alongside actual measured performance. The use of AI allows Aristotle to handle complex patterns and large datasets that would overwhelm manual analysis, and to update models far more frequently than a human could. Importantly, even as it uses modern tools, the modeling approach remains grounded in physics and industry-accepted practice (for example, ensuring that models meet the goodness-of-fit criteria of ASHRAE Guideline 14 and that any simulation-based methods follow the calibration guidelines). The platform can support classic M&V modes: it can function like IPMVP Option C (whole-building analysis using meter data and weather) or Option D (calibrated simulation), or a hybrid of both, depending on the data available for a given asset.
A core component of the platform’s innovation is its Hourly Carbon Accounting capability, integrated into the M&V calculations. WattCarbon maintains a library of emission factors and hourly grid carbon intensity data for electric grids in different regions. Aristotle links each hour of energy consumption or savings to the corresponding grid emissions factor for that location and time. This means when the platform calculates, say, 100 kWh of electricity savings in a given hour, it will also compute how many kilograms of CO₂ that saved, based on that hour’s actual grid mix. In regions with cleaner grids in certain hours (e.g. high renewable penetration overnight) and dirtier grids in others (peak hours when gas plants are running), this granular approach reveals exactly when carbon reductions occur. It provides a contrast to traditional carbon accounting that might use annual average emissions rates. Aristotle can show, for example, that an efficiency measure reduced load predominantly at 5pm on hot summer afternoons when the grid was carbon-intensive, yielding a higher carbon benefit than the same kWh savings would at 10am. The platform’s internal data model time-aligns all energy data with carbon intensity and even marginal emissions factors where available, enabling marginal carbon abatement calculations for demand response or load shifting interventions. This level of detail (hourly watt-hour and gram-of-CO₂ values) is recorded as an EAC and forms the basis of the platform’s outputs.
Methodologies and AI Applied in Automated M&V
While the data ingestion and modeling architecture is designed to manage significant data complexity, Aristotle’s analytic methodology remains transparent and grounded in established M&V techniques. Each project or asset onboarded to the platform is associated with an M&V methodology plan, essentially a digital specification of how savings will be computed. WattCarbon’s approach uses the OpenEAC Alliance’s library of methodologies as these plans. For example, if a user is tracking an energy efficiency retrofit in a commercial building, the platform might automatically apply a whole-building weather-normalized metered savings method (similar to IPMVP Option C) to that project. If another project is the installation of a heat pump replacing a gas furnace (an electrification project), the platform can apply an electrification-specific methodology that accounts for fuel switching, modeling the avoided gas usage and the new electrical usage to calculate net energy and emissions savings. These methodology definitions formalize the “counterfactual” baseline calculation for each project type in a way that is consistent and auditable.
Under the hood, Aristotle’s AI engine uses a combination of machine learning, statistical analysis, and simulation to implement the chosen methodology. In many cases, a baseline model is constructed from pre-intervention data (for retrofits) or from reference models (for new construction or equipment additions where pre-data may not exist, a calibrated simulation might be used initially). The platform might deploy advanced regression models, time-series forecasting (to handle occupancy or production schedule variations), or even ensemble techniques that switch models based on regimes (weekday vs weekend, seasonal changes, etc.). The “reference model” concept implies that for more complex systems, a hybrid approach can be taken: part data-driven (learning from data) and part physics-informed (using known equipment performance characteristics). This is particularly useful in scenarios like battery storage or PV solar: the platform knows the physics (e.g. a battery’s charge/discharge efficiency, or solar panel output equations) and uses data to issue alerts for unexpected usage patterns. The AI can detect when the real system is deviating from expected performance. This continuous feedback loop is a divergence from traditional practice, which typically develops models once at the start and assumes they remain static; Aristotle instead treats feedback as an ongoing process, improving the reliability of long-term savings tracking.
Crucially, every calculation Aristotle performs is traceable and defensible. Each hour of savings is backed by the input data (meter readings, weather, etc.) and a documented methodology. WattCarbon’s platform automatically generates transparent M&V reports detailing each step in the measurement process. These reports show the baseline model employed, the adjustments made (e.g. weather normalization, or occupancy normalization), and the resulting savings for each interval. The use of standardized open methods means stakeholders or third-party auditors can review the methodology documentation (which is version-controlled and published via the WEATS Registry) and even replicate the calculation if needed. In other words, Aristotle’s AI is not a “black box”. It is better described as an “automated calculator” implementing industry-approved formulas, but doing so on a volume of data and with a speed that manual calculation cannot match. The platform includes an audit trail such that any EAC (Energy/Environmental Attribute Certificate) it issues for a project can be traced back to the raw data and method used. Each savings record is effectively like a ledger entry with a unique ID, preventing double counting and ensuring accountability.
Outputs and Stakeholder Deliverables
One of the primary goals of Aristotle is to translate raw data and sophisticated analysis into clear, actionable outputs for stakeholders like building owners, energy managers, sustainability directors, and investors. The platform delivers several types of outputs:
Real-Time Dashboards and Alerts: Users have access to a cloud dashboard that provides a portfolio-wide view of all their projects and assets. Interactive charts show energy consumption vs. baseline in real time, with savings updating continuously. Projects can be compared and benchmarked to identify which buildings are yielding the greatest improvements and which ones lag behind, focusing attention where it’s needed. The platform issues alerts for anomalies or threshold violations. For example, a user will want to know if a building’s energy use suddenly spikes above the modeled baseline (possibly indicating equipment malfunctions or drift in performance), or if a demand response event did not achieve the expected load drop. By catching these issues immediately, stakeholders can respond proactively (tuning operations, scheduling maintenance, etc.), rather than finding out at the end of the year that savings were lower than expected.
Automated M&V Reports: Aristotle generates detailed M&V reports for any selected EAC output. These reports document the baseline model accuracy statistics, the total savings (energy and carbon) achieved, and breakdowns by time or by source. They effectively automate what an engineering consultant would traditionally produce as an M&V report, but with far greater speed and consistency. Each report is audit-ready insofar as all assumptions are explicit and the underlying data is referenced. This gives confidence to both internal stakeholders and external verifiers. A sustainability director can use these reports to back up their claims of energy savings in ESG disclosures or to support incentive payments from utility programs. Because the data is updated continuously, getting an M&V report no longer requires waiting until the project’s end. One can pull a report even a few weeks after project implementation to see early results, or continuously monitor savings on the dashboard.
Certified Energy/Carbon Savings: A unique feature of WattCarbon’s platform is the creation of Energy/Environmental Attribute Certificates (EACs) which quantify verified energy and carbon reductions. As Aristotle calculates the hourly savings for a project, these savings are packaged into certificates, each with a unique serial number and metadata describing the project, time, and methodology. For example, a building retrofit project might generate certificates for 500 kWh saved and 200 kg CO₂ avoided during a particular month, based on the hourly data aggregated. These certificates serve as a system of record for each asset. They are registered in WattCarbon’s WEATS registry and potentially transacted (for organizations that earn revenue from carbon credits or energy saving performance contracts). By tokenizing energy savings and carbon reductions in this way, with full traceability, Aristotle provides a mechanism to monetize or trade the “negawatts” and avoided emissions, turning them into fungible assets. Investors or programs that fund efficiency can be issued these digital certificates as proof of the outcomes, fostering trust that their capital indeed delivered quantifiable carbon impact.
APIs and Integration: For organizations that have their own analytics platforms or sustainability reporting systems, Aristotle offers API access to the data. All calculated metrics (hourly consumption vs. baseline, emissions, etc.) and certificates can be exported programmatically. This means a company can integrate the real-time M&V results into their enterprise dashboards or even trigger automated actions (for instance, adjust operations if an asset isn’t meeting its savings targets). The platform’s open-data approach ensures that the information is not siloed. Furthermore, Aristotle’s outputs are designed to meet emerging regulatory and disclosure requirements. For example, with the move toward more rigorous climate reporting, having hourly, asset-level carbon data provides corporations a stronger evidentiary basis for their reported emissions and reductions. Stakeholders from sustainability teams to financial auditors benefit from the transparent, defensible data that Aristotle delivers.
Use Cases Across the Energy Transition
Because Aristotle’s automated M&V system is flexible and data-driven, it can support a wide range of decarbonization use cases. Below we highlight how the platform applies to various project types, from classic energy efficiency to cutting-edge grid-interactive assets.
Energy Efficiency Retrofits
For traditional energy efficiency measures (lighting upgrades, HVAC improvements, building envelope enhancements, etc.), Aristotle automates the entire M&V cycle. Typically, these projects align with an IPMVP Option C whole-building approach or Option B retrofit isolation if submetering is available for the affected systems. The platform will ingest the building’s meter data (and any relevant submeter or sensor data), establish a baseline using pre-retrofit performance (adjusting for weather, occupancy, production levels, etc.), and then continuously measure the drop in energy use once the retrofit is in place. For example, imagine an office building that upgraded all lighting to high-efficiency LEDs. First, Aristotle’s reference model for the building will predict the reduction in energy consumption as part of the whole-building load profile. Once the LEDs are installed, the M&V engine will detect that for the same occupancy and hours of operation, evening electricity use is, say, 30% lower than would have occurred with old lights. The reference model will serve as a point of comparison to evaluate the impact of the retrofit relative to expectations.
The result is a continuous verification of savings: building owners can see in near real-time how much energy (and money) the LEDs are saving, rather than waiting for a year-end verification. If the savings are trending below expected (perhaps some fixtures weren’t replaced or are miscontrolled), the system flags it early. In terms of carbon accounting, those reduced kWh each hour are converted to avoided CO₂ with the appropriate hourly emissions factors from the grid. This could show, for instance, that an efficiency retrofit in a grid region with coal-heavy peak power yields significantly more carbon reduction per kWh saved during peak hours than during off-peak. Aristotle’s hourly analysis would capture that and report both total kWh and kg CO₂ saved. All of this is accomplished following standard principles (as outlined in IPMVP and ASHRAE guidelines) but executed with higher frequency tracking at lower cost. The outcome is a defensible record of energy savings for use in utility incentive claims or corporate sustainability metrics, without the need to hire external M&V consultants.
Building Electrification (Fuel Switching)
Building electrification, such as replacing a gas-fired boiler with an electric heat pump, or a gas water heater with a heat pump water heater (HPWH), is a key strategy for decarbonization. However, electrification presents a unique M&V challenge: increased electrical usage (which the meter sees) coupled with reduced on-site fuel combustion (often not directly metered by the electric utility). Aristotle addresses this by employing a hybrid reference model that integrates both the previous and new systems. When an electrification project is registered, the platform sets up a baseline representing the thermal energy that was previously provided by fossil fuel. This could involve using metered gas consumption data, device-level simulations, or manufacturer performance data for the old equipment to estimate how much gas would have been used hour by hour, based on the building’s heating demand and weather conditions.
Meanwhile, Aristotle also models the building’s expected electric consumption under those same conditions. Once the project is live, the platform measures the actual electricity consumed by the heat pump (via the meter data or submeter on the device) and compares it to the combined baseline (what the gas usage would have been plus any electric usage that was there before). This yields both the net energy change and the change in emissions. For example, a heat pump may use 3 kWh of electricity to deliver the same heating that 1 cubic meter of natural gas would have provided. The platform will show perhaps a slight increase in site energy use (if we only consider kWh), but it will also account for the avoided gas combustion. The emissions calculation will incorporate the gas CO₂ factor (which was avoided) and the electricity CO₂ (which is now incurred). If the electricity is much cleaner (as it often is, especially if paired with renewable energy), the net result is a significant CO₂ reduction.
Aristotle automates this complex accounting, using methodologies specifically approved for electrification projects. It effectively creates a virtual gas meter in the reference model to track avoided fuel use. This is invaluable for proving the impact of electrification: historically, if one just looked at the electric bill after such a project, they’d see higher kWh and might think energy performance worsened, unless a careful analysis is done. Aristotle provides that careful analysis continuously, demonstrating that although the form of energy changed, the overall carbon emissions and site energy content (BTUs) are improved. This helps justify electrification investments by showing the real climate ROI. Moreover, the platform’s hourly carbon view is critical here. It can show if an electrification project is resulting in increased load during peak grid times and help strategize around that (maybe by shifting some loads, adding smart controls or thermal storage to minimize high-carbon grid usage).
Battery Energy Storage Systems (BESS)
Batteries in buildings (or connected to them) are used to shift energy usage in time, charging during low-cost or low-carbon periods and discharging during high demand periods. Verifying the benefit of a battery can be complex because it doesn’t necessarily save energy (in fact there are some losses), but it can greatly reduce peak demand and ensure more consumption is met by cleaner sources. Aristotle handles battery projects by tracking two primary effects: peak demand reduction and load shifting for carbon optimization. For M&V, the baseline in a no-battery scenario is that the building’s demand profile would follow its natural pattern (perhaps a big peak at 5pm when HVAC and other loads coincide). With the battery, that peak is shaved.
The reference model uses telemetry data collected from the battery to create a record of charging and discharging, which allows it to create a profile of what the demand would have been without storage, and then measures the actual with storage. The difference at each time step is the impact of the battery. If a battery discharges 50 kW at the 5pm peak, the platform will record a 50 kW reduction in grid demand for that hour (and corresponding kWh shifted). Over time, these hourly differences can be integrated into total “energy savings” from the grid’s perspective (even if not a reduction in consumption, it is a reduction in peak supply needs). The Uniform Methods Project doesn’t have a standard battery protocol, but Aristotle leverages techniques from demand response M&V and even utility demand charge calculations to quantify this.
On the carbon side, the platform looks at when the battery charged versus when it discharged. If, for instance, the battery charges at 1am (when the grid CO₂ intensity was 200 g/kWh) and displaces power at 5pm (when grid intensity was 400 g/kWh), Aristotle calculates the net carbon benefit of that 1 kWh shifted is roughly 200 g (the difference) minus any efficiency losses. Summed over all hours, the platform can report how many kg of CO₂ the battery system is avoiding by time-shifting energy. It will also account for round-trip efficiency: if 10% extra energy was drawn to charge (losses), that is counted against the benefit. All of this is done automatically and in near real time. Stakeholders get a clear view each day of how the battery operated and what the measurable impact was, whether for demand charge management or carbon reduction. If the battery is not being utilized optimally (say it’s charging and discharging at suboptimal times), the system’s analytics can highlight that and suggest better scheduling to maximize benefits. In essence, Aristotle provides a continuous commissioning tool for batteries, ensuring they deliver on their intended goals and providing verified data for any claims of peak reduction or emission savings.
Electric Vehicle (EV) Charging
EV charging in commercial buildings (offices, fleets, multifamily housing) is another growing piece of the energy puzzle. From one perspective, EV charging increases building energy use, but it displaces gasoline or diesel consumption in vehicles, yielding a net climate benefit. Aristotle’s platform can integrate EV charging stations as part of a building’s reference model. Similar to electrification, the baseline for an EV project can be defined as “vehicle would have run on gasoline for X miles.” If the data is available, WattCarbon can incorporate the fuel use data (or use standardized factors, e.g. an EV charging 40 kWh replaces a gasoline car driving Y miles consuming Z gallons). The platform will thus compute avoided fuel emissions concurrently with the measured electricity used for charging.
Many building managers may focus simply on managing the additional electric load. Aristotle can provide insights on load management for EVs: e.g. verifying that smart charging systems are properly staggering loads to avoid spikes. If an EV charging management system claims it reduced peak draw by coordinating charging, Aristotle’s meter-based verification will show the counterfactual peak vs. actual. Hourly carbon accounting is particularly useful here too. EV charging can be scheduled when grid carbon is lowest (for example, late night when wind power is abundant). The platform can track how much of the EV charging energy was done during “green” hours vs “brown” hours and quantify the difference in emissions. This is valuable for companies trying to achieve 24/7 carbon-free energy goals. They can not only buy renewables, but also ensure EVs charge at optimal times and prove it.
Additionally, if EV chargers are bidirectional (vehicle-to-grid), their behavior can be treated similar to batteries in the M&V system. Aristotle, through its flexible data model, essentially can treat an EV charger plus EV as a dynamic asset with both consumption and possible discharge. It will consistently apply the baseline of “what if this EV wasn’t here or wasn’t managed” vs. actual, to isolate the impact. For investors in fleet electrification, the platform provides a verification of fuel cost savings and carbon reduction per vehicle in the fleet, aggregated in one place, rather than having to manually combine vehicle telematics with utility bills.
Demand Response and Load Flexibility
Demand response (DR) programs pay customers to reduce load during peak events or grid stress events. M&V for DR typically involves computing a baseline of what the load would have been during the event (using methods like the 10-of-10 baseline or regression models) and then measuring the actual load drop. Aristotle automates DR event M&V by leveraging its continuously learned models. Since the platform is already modeling the facility’s behavior, when a DR event happens (say on a particular afternoon for 2 hours), it can immediately compute the counterfactual baseline for that period using its reference. This can be more accurate than simplistic baseline methods, because it can account for operational changes, weather, day-of adjustments, etc., in a sophisticated way (similar to CalTRACK or other advanced DR baseline methods). The result is an immediate calculation of kilowatts curtailed during the event. This is delivered right after the event, rather than weeks later, enabling program participants to know if they met their targets.
On the emissions side, demand response is increasingly viewed as an emissions reduction strategy (e.g. avoiding the need to run peaker plants). Aristotle will quantify the avoided energy (kWh) and associated emissions for each event hour. If the grid was particularly dirty at that time, the DR event’s carbon benefit is calculated and can be aggregated into the project’s overall impact. This real-time verification is extremely useful for emerging carbon markets that might reward load flexibility that reduces emissions. Instead of relying on blunt estimates, the platform provides a defensible, fine-grained accounting of each demand response action. For instance, a commercial building that participates in 10 DR events a year can have an annual report (or even a certificate per event) saying exactly how much energy and CO₂ was avoided per event. This builds trust with grid operators and can support pay-for-performance models. From the user’s perspective, having a single system track both their efficiency improvements and their demand response performance is a bonus. It’s all part of the holistic view of how their building interacts with the energy system, whether reducing overall consumption or strategically timing it.
Traditional vs. Automated M&V: Key Differences
Automating M&V with an AI platform like Aristotle yields significant advantages over the traditional approach. The table below summarizes the differences in cost, speed, granularity, and defensibility of results:
Data Granularity & Frequency: Traditional M&V often relies on monthly utility bills or a few spot measurements, providing coarse insights. In contrast, Aristotle uses high-frequency interval data (hourly or sub-hourly), enabling analysis of load shapes and savings at each time step. This means granular visibility into when and how savings occur, uncovering patterns (e.g. nighttime setbacks, weekend operations) that monthly data would mask. The result is a richer understanding of project performance.
Speed of Results: Manual M&V might take weeks or months after data collection to produce a verified savings report. Often one only truly knows the savings long after project implementation. Aristotle’s automated engine delivers near real-time results. As soon as data is available, the platform updates the savings calculations. This continuous verification accelerates feedback; stakeholders can validate ROI immediately and make any necessary adjustments in operations while the project is ongoing, not afterward. Essentially, it turns M&V from a one-time audit into a continuous commissioning tool.
Cost Efficiency: Conventional M&V requires significant labor by skilled analysts or engineers. As noted, industry guidelines suggest M&V can cost 5–10% of project expenditures. Automated M&V drastically lowers the per-project cost by leveraging the same software platform across many projects. Once Aristotle’s data integration is set up, adding another building or measure has minimal marginal cost. This makes robust M&V feasible even for smaller projects that previously couldn’t justify the expense. Overall program administrators or ESCOs (Energy Service Companies) can scale up M&V across a portfolio without a linear increase in effort. Additionally, the avoidance of third-party verification contracts for every project can translate to large savings, as human experts can instead be focused on oversight of the automated system and handling exceptions, rather than doing every analysis from scratch.
Defensibility & Transparency: Traditional methods rely on the competency of individuals and often proprietary spreadsheets or models. It can be hard for outsiders to fully verify the calculations without redoing the work. Aristotle improves defensibility by using standardized, peer-reviewed methodologies (via OpenEAC) and automatically generating a detailed audit trail for each result. Every assumption (weather adjustments, baseline selection) is explicit, and the raw data is linked. This level of transparency is seldom achievable in manual M&V reports due to time constraints. Furthermore, because the methods are consistent, there’s less room for unintentional bias or overly optimistic savings estimates; the same rules are applied uniformly. From a stakeholder perspective (be it a financial investor, an auditor, or a sustainability officer), the numbers coming out of Aristotle carry weight because they are backed by both solid data science and industry-approved calculation methods. In short, results are more reproducible and thus more credible.
Scope of Metrics: Traditional M&V primarily gives you energy unit savings (kWh, therms) and maybe peak kW reduction. Any conversion to carbon or financial metrics is done as a separate, simple multiplication step. Aristotle provides a much broader set of integrated metrics, as every report includes not just energy savings but also emissions reductions (Scope 2 carbon), and even avoided Scope 1 emissions for fuel-switching cases, computed with granularity and accuracy. It can also translate savings into dollars using tariff data if needed, giving a full picture of project value. Essentially it bridges the gap between energy management and carbon accounting automatically, whereas traditionally one would have to marry energy data with emissions data offline.
Scalability & Portfolio Insights: Perhaps one of the biggest differences is in multi-site management. If you have 100 buildings with efficiency projects, the manual M&V approach would treat each building as a separate effort, and then someone might roll up the results in a spreadsheet. With an automated platform, all buildings can be onboarded and analyzed in parallel, and the portfolio results are available at a click. This not only saves effort but unlocks new analysis. You can rank buildings by realized savings vs. predictions, you can cluster buildings by performance profiles, and you can manage a program in a data-driven manner. The speed and automation allow for program-level M&V analytics that traditionally might only be done in a retrospective evaluation study. It’s the difference between having a near-real-time energy management system versus sporadic M&V snapshots.
To visualize one aspect of these differences, consider the granularity of data. Figure 2 shows an example of how an automated M&V model captures hourly changes in a building’s energy use versus a baseline, whereas a traditional approach might only report the total monthly savings. The shaded green areas indicate the energy saved in each hour, information that Aristotle makes available continuously to drive operational decisions.
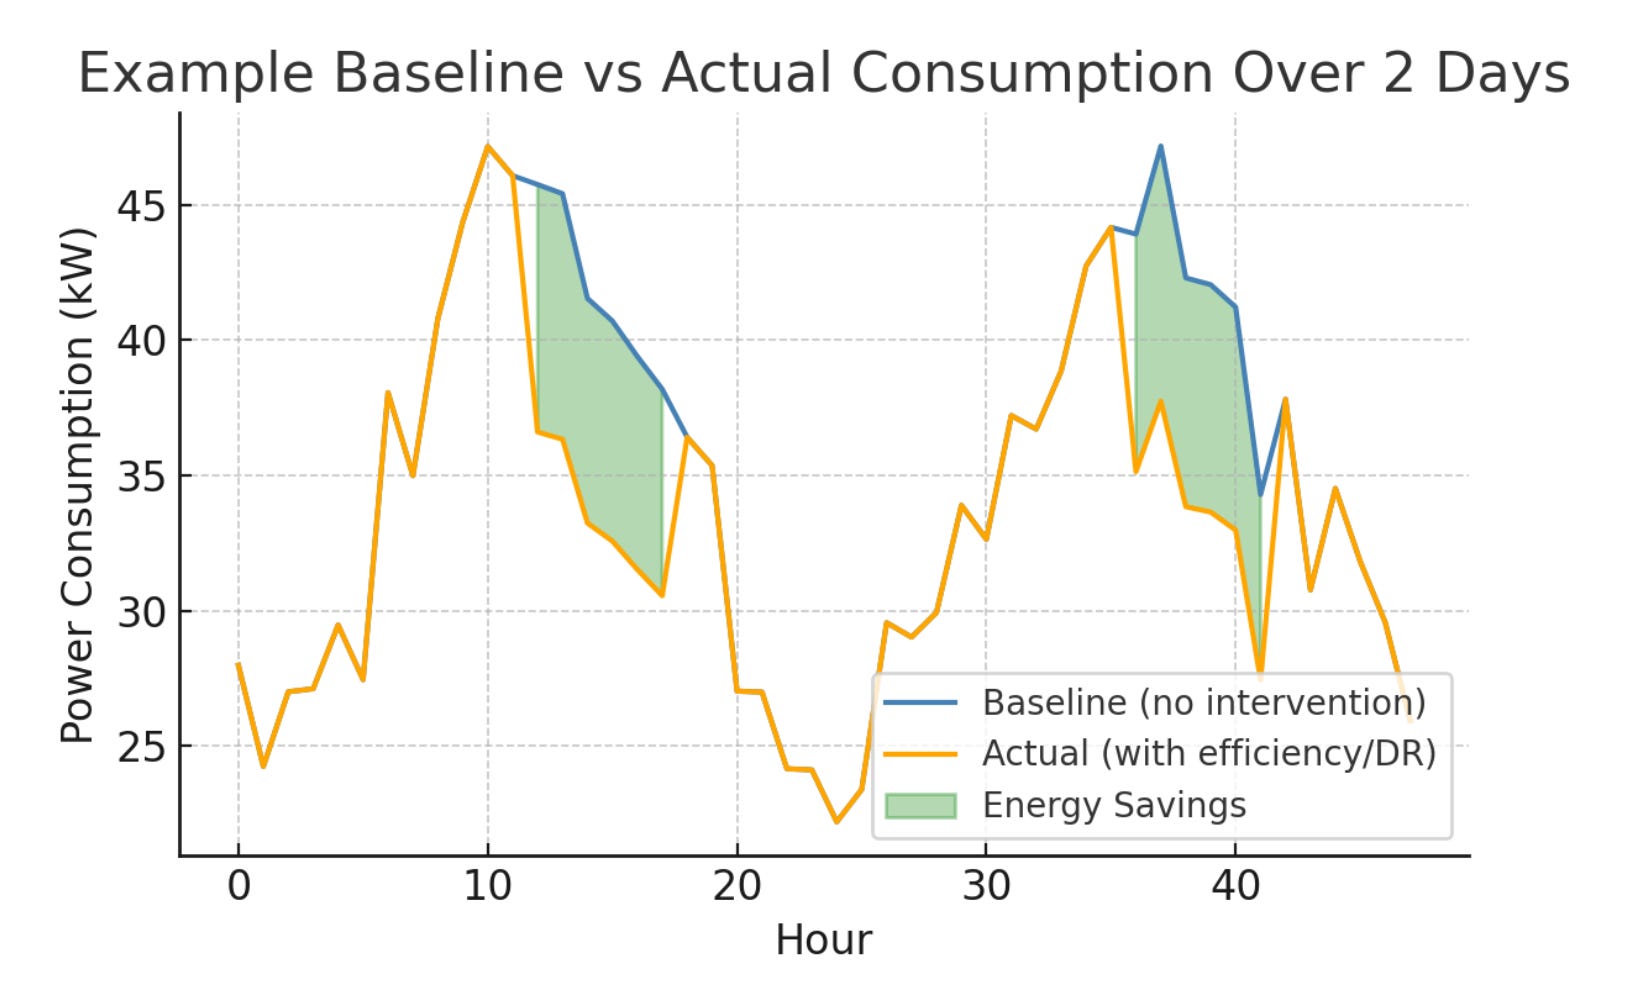
Figure 2: Example Baseline vs. Actual Consumption Over Time. In this conceptual illustration, a building’s baseline (blue line) represents expected power draw without an efficiency measure, while the actual consumption (orange line) is lower during certain hours due to the measure (for instance, a demand response event or an efficiency improvement). The green shaded areas highlight the hourly energy savings. An automated M&V platform captures these dynamics hour-by-hour, showing not just how much energy was saved, but when it was saved. Traditional M&V would typically report only the aggregated savings over a period, losing the temporal detail that can inform operational strategy (such as targeting future savings during the highest load hours or highest carbon intensity hours).
Conclusion and Future Outlook
Aristotle represents a significant step forward in how energy and carbon performance is measured in the built environment. By fusing AI-driven modeling with the rigor of established M&V protocols, it delivers an M&V solution that is faster, more granular, and more scalable without sacrificing accuracy or credibility. In fact, Aristotle arguably increases the credibility of results by eliminating manual errors and by providing transparent, tamper-proof records of every calculation. The platform effectively operationalizes the vision of continuous M&V that industry experts have anticipated as smart meter data became widespread. It also pioneers the integration of hourly carbon accounting, creating a new standard for what it means to truly track decarbonization progress (aligning well with emerging demands for 24/7 carbon tracking and verified Scope 2 emissions reporting).
From an engineering perspective, Aristotle can be seen as an “expert M&V engineer” living in the cloud, one that processes gigabytes of data with ease, and always adheres to the agreed methodology. From an investor or sustainability executive perspective, it provides a level of assurance and insight that de-risks projects: one can invest in an energy efficiency or DER project and immediately verify its performance and carbon impact, increasing confidence in the payback and climate benefits. This real-time ROI validation loop can help unlock more capital for such projects, as stakeholders gain trust that savings will be delivered and proven. It also helps organizations optimize operations in flight, effectively squeezing more savings out of projects through continuous improvement (something not possible when you only check M&V results long after the fact).
It’s important to note that automated M&V doesn’t eliminate the need for human expertise, rather, it elevates the role of experts to focus on designing projects and interpreting insights instead of crunching numbers. Engineers can use platforms like Aristotle to quickly test scenarios (what-if analyses via the reference model), validate strategies like load shifting, and ensure persistence of savings over time. The reference model approach means the model of the building or asset is always up-to-date; if building usage patterns change or new equipment is added, the AI model adapts, providing a living simulation of the building. This opens the door to future capabilities where the same model used for M&V could be leveraged for predictive control or optimization (closing the loop from measurement to action).
WattCarbon’s Aristotle is launching at a time when the intersection of energy efficiency and carbon accountability is especially critical. Policies and markets are increasingly requiring proof of carbon reductions, whether through local building performance standards, carbon trading mechanisms, or corporate ESG commitments. By automating the adherence to standards like IPMVP and extending them into carbon metrics, Aristotle provides the “rigorous proof of impact” that stakeholders demand. It brings consistency and trust to a landscape that used to be fragmented by varying methods and assumptions. As more projects are tracked through the platform and more methodologies are developed by the OpenEAC community, we can expect a virtuous cycle: better data and verification will lead to better project performance, which in turn will encourage more investment in decarbonization projects.
Aristotle demonstrates how the latest in AI and cloud technology can turbo-charge a classic engineering discipline. It honors the industry’s hard-won M&V best practices (ASHRAE, IPMVP, UMP, etc.) by encoding them in software, and then goes beyond by delivering insights at the speed of digital. The result is an M&V platform for the modern energy era, one that not only measures what has been achieved but also actively guides the next steps on the path to net-zero. With tools like this, building operators and investors are empowered to accelerate decarbonization with confidence, armed with continuous, credible data on every watt-hour saved and every gram of carbon avoided.1
Sources: This white paper references established M&V standards and current technical literature to provide context and validation for the Aristotle platform’s approach. Key references include ASHRAE Guideline 14 and IPMVP definitions of M&V methods (What is ASHRAE Guideline 14 and How Does It Affect Your M&V?) (What is ASHRAE Guideline 14 and How Does It Affect Your M&V?), DOE’s Uniform Methods Project guidelines ([PDF] Methods for Determining Energy Efficiency Savings for Specific ...), and CalTRACK open-source M&V methods (CalTRACK Hourly Methods | How It Works | Recurve).
Wow, very thoughtful and thorough whitepaper, and an exciting vision for M&V 2.0!
Looks interesting, and it tracks what was shown by the ASHRAE Predictor Competition III that showed that ANNs hold promise on their abililty to monitor and automatically predict the performance of whole-building or submetered energy use. It would be interesting to see how well Aristotle does by testing it against the Predictor Shootout I, II and III databases... Jeff Haberl, TAMU. PS: If you can't find access to the PS I, II or III database let me know.